Skip to content
Free Shipping On All Supply Orders StudioCore K-12 Software Included Free A+ Rated by the BBB Trusted by Over 4,600+ Schools TIPS Contract #250802 Free Shipping On All Supply Orders StudioCore K-12 Software Included Free A+ Rated by the BBB Trusted by Over 4,600+ Schools TIPS Contract #250802 Free Shipping On All Supply Orders StudioCore K-12 Software Included Free A+ Rated by the BBB Trusted by Over 4,600+ Schools TIPS Contract #250802 Free Shipping On All Supply Orders StudioCore K-12 Software Included Free A+ Rated by the BBB Trusted by Over 4,600+ Schools TIPS Contract #250802
866-788-7900
Poster Studio Express
  • Poster Makers
  • Package Selector
    • StudioCore
    • Poster Design Service
    • 5 Year Warranties
    • Wireless / Remote Printing
    • Print From Any Device
    • Education Poster Template Content
    • Cost Per Print
    • Size Comparisons
    • Blog
    • FAQs
    • Video Library
    • Reviews
    • — Customer Stories
    • Funding
    • About Us
    • Schedule Installation
    • Live Studio Demo
    • Product Registration
Account Cart See Pricing Pricing
Education Express Series school poster printer
Education Express Series
View Express Series Express Supplies
Education Studio Series wide-format poster maker
Education Studio Series
View Studio Series Studio Supplies
Education Flex Series print-and-cut poster maker
Education Flex Series
View Flex Series Flex Supplies
Education Print Center Series production poster printer
Print Center Series View Print Center
Explore More
Poster Maker Packages

Browse every PSE poster maker package and bundle.

Poster Printer Cutters

Print & cut systems for CTE and spirit-wear teams.

Sublimation Printers
  • Features
  • FAQs
  • Fundraising
School Poster Makers 101
  • Glossary
  • Best Practices

Not sure which series fits your school? Browse the full lineup, see specs side-by-side, and read about packages.

View All Poster Makers
Poster Maker Supplies
  • Express Package Supplies
  • Studio Package Supplies
  • Paper and Media
  • Inks
  • Supply Packs
Poster Printer Cutter Supplies
  • Paper and Media
  • Inks and Accessories
Sublimation Printer Supplies
  • Paper and Media
  • Inks and Accessories
  • Sublimation Blanks
Laminators and Laminate
  • Selecting a Laminator
Mounting Solutions Mount & display systems →
Heat Press Machines Sublimation transfer presses → Education Flex Award Maker Custom plaques & awards →
Popular: Studio Series Canva Integration StudioCore Ink & Supplies Pricing
Poster Studio Express
See Pricing
    • View All Poster Makers
    • Education Express Series
    • Education Studio Series
    • Education Flex Series
    • Print Center Series
    • Poster Maker Packages
    • Poster Printer Cutters
    • Sublimation Printers
      • Features
      • FAQs
      • Fundraising
    • School Poster Makers 101
      • Glossary
      • Best Practices
  • Package Selector
    • StudioCore
    • Poster Design Service
    • 5 Year Warranties
    • Wireless / Remote Printing
    • Print From Any Device
    • Education Poster Template Content
    • Cost Per Print
    • Size Comparisons
    • Poster Maker Supplies
      • Express Package Supplies
      • Studio Package Supplies
      • Paper and Media
      • Inks
      • Supply Packs
    • Poster Printer Cutter Supplies
      • Paper and Media
      • Inks and Accessories
    • Sublimation Printer Supplies
      • Paper and Media
      • Inks and Accessories
      • Sublimation Blanks
    • Mounting Solutions
    • Laminators and Laminate
      • Selecting a Laminator
    • Heat Press Machines
    • Education Flex Award Maker
    • Blog
    • FAQs
    • Video Library
    • Reviews
      • Customer Stories
    • Funding
    • About Us
    • Schedule Installation
    • Live Studio Demo
    • Product Registration
Call 866-788-7900 Account Sign In
Poster Perspectives Home
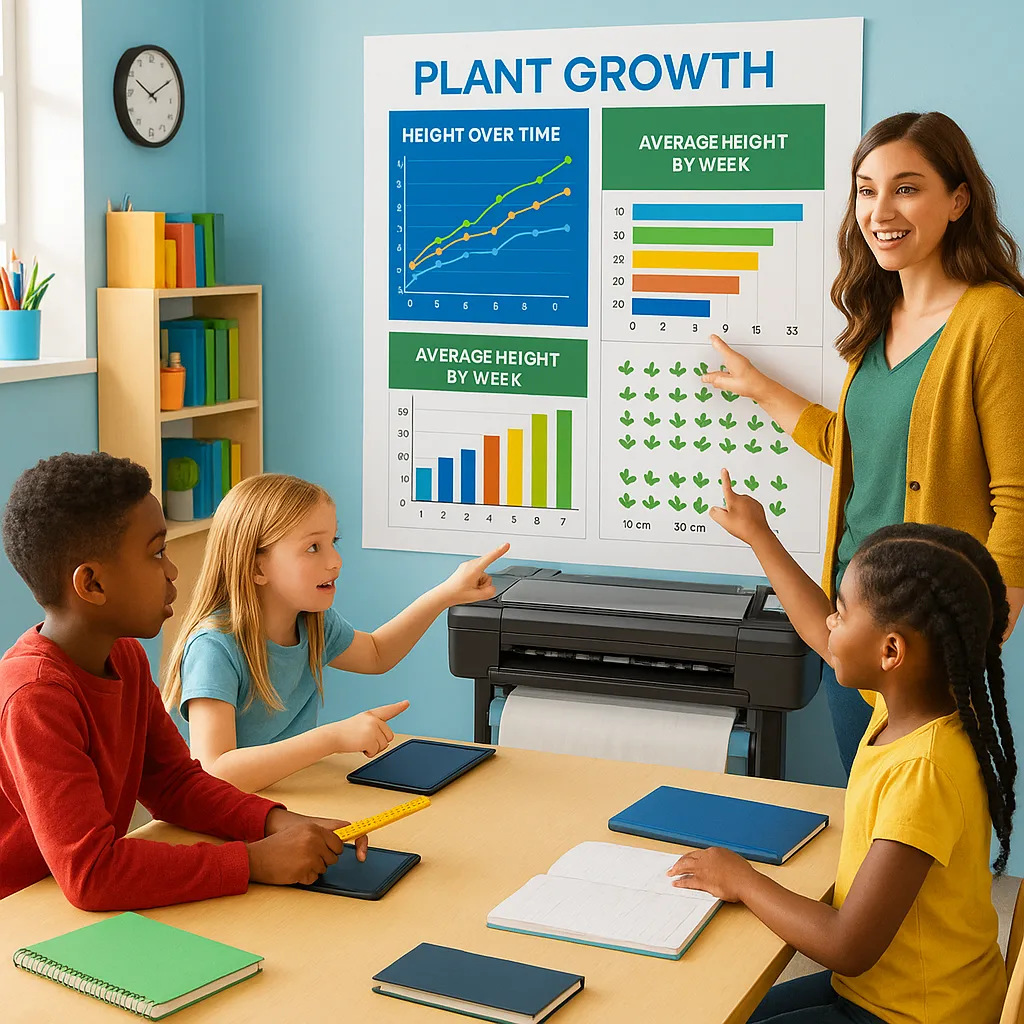
A vibrant, classroom scene diverse K-12 students gathered around a large wall-mounted data visualization poster displaying colorful scientific charts and graphs. The poster shows plant growth data

School Poster Maker STEM Data Visualization Guide

By Dr. Ethan ColePublished On: August 28th, 2025

Visual Storytelling in STEM: Creating Data-Rich Posters That Spark Scientific Thinking

Drawing from my years translating NASA mission data into classroom demonstrations, I’ve witnessed firsthand how visual storytelling transforms abstract STEM concepts into tangible learning experiences. When schools invest in a school poster maker STEM visualization system, they unlock the power to turn complex datasets into compelling narratives that ignite scientific curiosity across all grade levels.
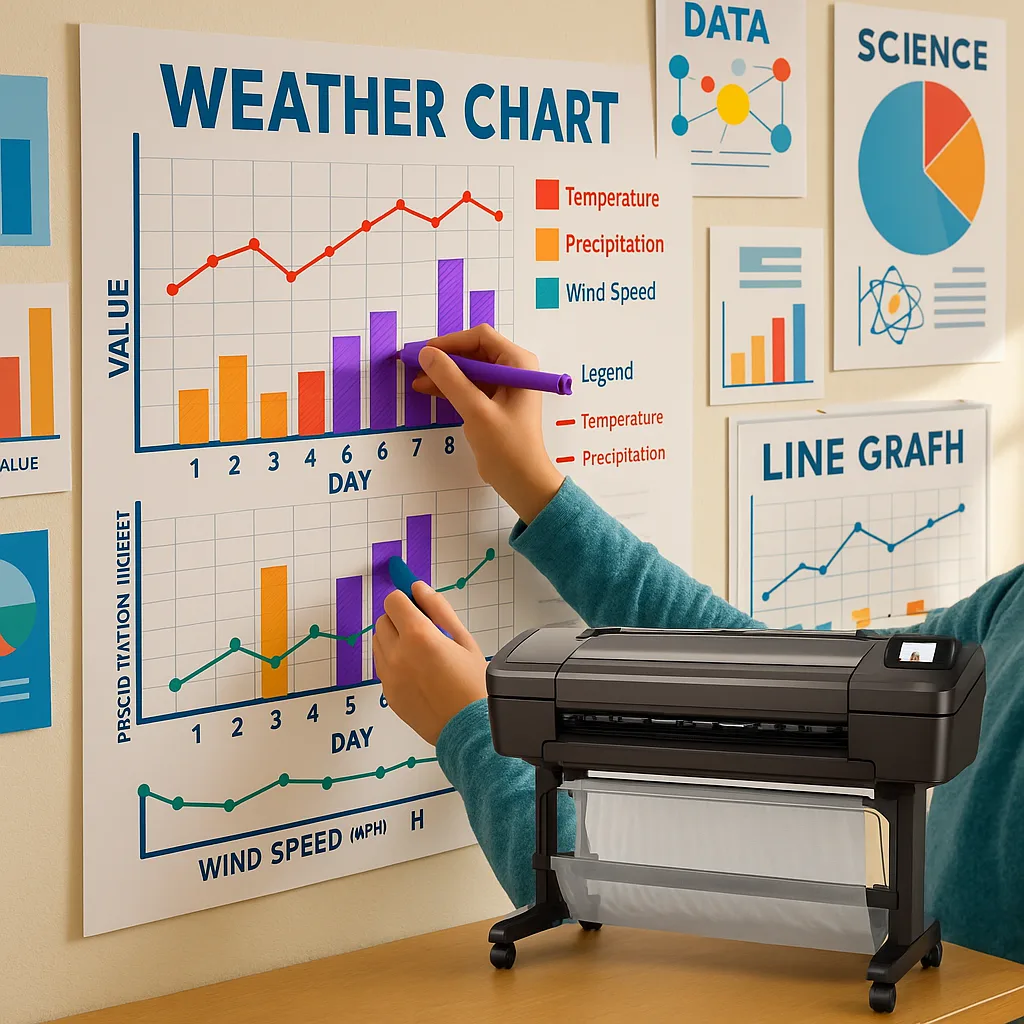
A close-up shot of a student's hands using colorful markers to update a large interactive data wall poster a weather tracking chart. The poster displays temperature, precipitation, and wind speed

The Science Behind Visual Data Processing in Young Minds

Research from cognitive neuroscience reveals that the human brain processes visual information 60,000 times faster than text. Furthermore, studies show that students retain 65% of information when it’s paired with relevant visuals, compared to just 10% when presented as text alone. This neurological advantage makes a poster maker machine an essential tool for STEM education.

In my NSF ITEST projects spanning 37 partner schools, we documented significant improvements in STEM identity when students created their own data visualizations. Moreover, the act of translating numbers into visual stories activates multiple cognitive pathways simultaneously. This multi-modal engagement strengthens conceptual understanding and long-term retention.

Elementary students particularly benefit from color-coded data representations. Research indicates that strategic use of color can improve data comprehension by up to 73%. Therefore, when selecting visualization tools, consider how a school poster maker with vibrant color capabilities can enhance your students’ analytical skills.

Age-Appropriate Chart Selection Framework

Through extensive classroom testing, I’ve developed a framework for matching visualization types to developmental stages. Each age group processes visual information differently, requiring thoughtful chart selection to maximize comprehension and engagement.
Elementary STEM visualization

Elementary Level (K-2)

Improve classrooms with our efficient poster making machine.

Pictographs & Bar Charts Concrete visual representations One-to-one correspondence Limited to 3-4 data points
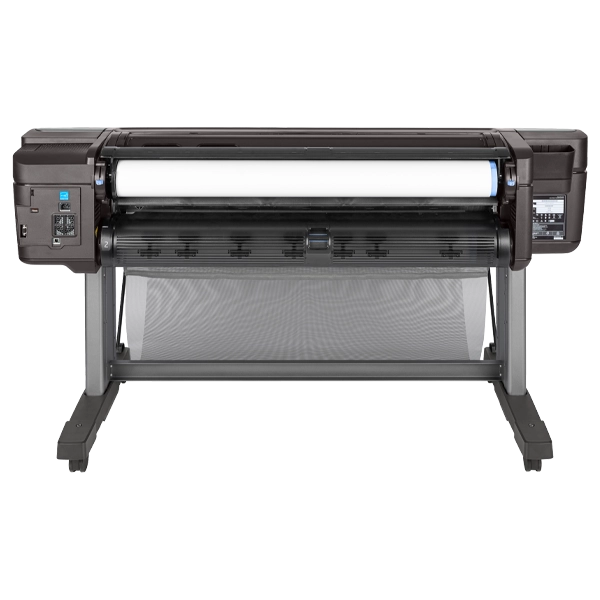
Middle school STEM visualization

Middle School (6-8)

Achieve professional results with our cutting-edge poster maker printer.

Line Graphs & Scatter Plots Multiple variables Trend identification Basic correlation concepts

High school STEM visualization

High School (9-12)

Experience multifunction capabilities from poster studio express with our poster maker packages.

Multi-Axis Charts & Heat Maps Complex relationships Statistical analysis Predictive modeling

Implementing School Poster Maker STEM Visualization Strategies

Creating effective STEM visualizations requires more than just technical skills. Based on my experience facilitating NASA eClips demonstrations, successful implementation follows a systematic approach that engages students as active data storytellers.

Step 1: Data Collection as Scientific Practice

Begin with hands-on experiments that generate meaningful data. For instance, tracking plant growth under different light conditions provides rich datasets for visualization. Students document measurements daily, creating ownership of the data story they’ll eventually tell through their posters.

Subsequently, guide students to organize their data in simple spreadsheets. This organizational step bridges the gap between raw observations and visual representation. Furthermore, it introduces fundamental data literacy skills essential for 21st-century STEM careers.

Step 2: Choosing the Right Visualization Type

Match your visualization to both the data type and your learning objectives. Continuous data like temperature changes work best with line graphs, while categorical comparisons shine through bar charts. Additionally, consider your audience’s visual literacy level when making these decisions.

73%

Improvement in data comprehension when using color-coded visualizations

65%

Information retention with visual + text combination

Interactive Data Wall Implementation Guide

Interactive data walls transform static displays into living laboratories. Using a school poster maker, educators can create large-format templates that students update throughout extended investigations. This approach mirrors real scientific practice while building data literacy skills.

Design your data wall with designated spaces for hypotheses, ongoing measurements, and emerging conclusions. Include QR codes linking to digital datasets, allowing deeper exploration. Most importantly, position the wall at student eye level to encourage interaction and ownership.

Real-World Applications: STEM Visualization Success Stories

Across our NSF ITEST partner schools, we’ve documented remarkable outcomes when students create their own data visualizations. One particularly compelling example comes from a middle school environmental science class tracking local water quality over a semester.

Students used their poster maker machine to create weekly updates showing pH levels, dissolved oxygen, and temperature variations. Subsequently, they presented their findings to the city council, demonstrating how visual storytelling amplifies student voice in real-world contexts. The professional quality of their posters, produced with the Education Express Package A, added credibility to their scientific findings.

Another success story involves high school physics students visualizing projectile motion data. They created time-lapse poster series showing trajectory calculations overlaid on actual experimental results. This visual comparison helped identify sources of experimental error while reinforcing theoretical concepts.

Technical Considerations for STEM Posters

Creating effective STEM visualizations requires attention to technical details that enhance clarity and accuracy. Based on NASA’s data visualization standards, here are essential guidelines for educational STEM posters.

Chart Design Standards: Always include clear axis labels with units, maintain consistent scale intervals, use high-contrast colors for accessibility, and provide a descriptive title that includes the measurement period.
Color Psychology in Data: Blue conveys trust and stability for baseline data, green indicates growth or positive trends, orange highlights areas needing attention, and red should be reserved for critical values only.
Typography Guidelines: Use Roboto or Fira Sans for data labels (minimum 14pt), maintain 1.5x line spacing for readability, bold key findings but avoid all-caps, and ensure 30% white space for visual breathing room.
Layout Principles: Follow the Z-pattern for information flow, place legends adjacent to charts, group related visualizations with subtle borders, and maintain consistent margins throughout the poster.

Measuring Impact: Assessment Through Visual Data

Visual data presentations offer unique assessment opportunities beyond traditional testing. When students create data visualizations, they demonstrate multiple competencies simultaneously: mathematical reasoning, scientific methodology, design thinking, and communication skills.

Develop rubrics that evaluate both technical accuracy and visual effectiveness. Consider criteria such as data accuracy, appropriate chart selection, clear labeling, visual hierarchy, and narrative coherence. Additionally, peer review sessions where students critique each other’s visualizations build analytical skills while fostering collaborative learning.

Track student progress through portfolio collections of their data visualizations. This longitudinal view reveals growth in both STEM understanding and visual communication skills. Moreover, these portfolios serve as powerful evidence of learning for parents and administrators.

Transform Your STEM Classroom Today

Ready to revolutionize how your students engage with STEM data? Poster Studio Express provides everything you need to create stunning, educationally effective data visualizations. Our lifetime design service ensures you’ll always have expert support in creating compelling visual narratives.

Call 866-788-7900 to Learn More
Request Custom Pricing

Why Choose Poster Studio Express?

With over 4,200 schools nationwide trusting our solutions, we understand the unique needs of STEM educators. Our 5-year next business day warranty and cost-effective printing (starting at just $1.30 per poster) make professional-quality STEM visualizations accessible to every classroom. Experience the difference with our comprehensive demo video and join thousands of educators transforming STEM education through visual storytelling.
Published On: August 28th, 2025Categories: Design Archives, Education, Poster PerspectivesTags: classroom data displays, classroom visualization tools, data visualization, data-driven education, educational data charts, educational infographics, engineering design posters, experiment documentation posters, interactive data walls, interactive learning walls, large format STEM printing, math data visualization, poster design for science, Poster Maker Machine for Schools, Poster Studio Express, school poster maker, science fair displays, scientific method visuals, scientific thinking visuals, STEM classroom displays, STEM Education Posters, STEM engagement strategies, STEM poster templates, STEM project displays, student data tracking, student experiment posters, technology education visuals, visual learning STEM, visual STEM curriculum, visual storytelling science

See More Recent Posts

  • Growth mindset classroom poster template showing students combining ideas to build cognitive flexibility aligned to CCSS 7.SL.1.d from Poster Studio Express school poster makers
    What Is a Poster Making Machine? Everything K–12 Schools Need to Know in 2026

What Is a Poster Making Machine? Everything K–12 Schools Need to Know in 2026

  • Underwater-themed classroom poster with text "When I watch the characters act my heart feels... Happy? Sad? Scared?". Features a jellyfish, crab, and submarine window design.
    The Ultimate Guide: How to Make a Perfect Classroom Poster on Canva (And Print It BIG!)

The Ultimate Guide: How to Make a Perfect Classroom Poster on Canva (And Print It BIG!)

  • Large-Format School Poster Printer Machine and Technology Visual
    What to Look For in a Poster Printer Machine: Summer 2026 Edition

What to Look For in a Poster Printer Machine: Summer 2026 Edition

  • Poster Studio Express vs Generic School Poster Printers
    Poster Studio Express vs. Generic School Poster Printers: a Comprehensive Guide

Poster Studio Express vs. Generic School Poster Printers: a Comprehensive Guide

  • Studio 24 poster maker printing a colorful STEAM education poster featuring science, technology, engineering, arts, and mathematics graphics
    Why Your School Poster Printer Machine Needs Better Software

Why Your School Poster Printer Machine Needs Better Software

  • School Poster Maker Machine printing a poster - 2026 Version.
    The 2026 Definitive Guide to School Poster Printers

The 2026 Definitive Guide to School Poster Printers

Poster Studio Express

School poster makers, supplies, and software — trusted by thousands of K-12 schools across the country.

Site Map

  • Home
  • School Poster Makers
  • Supply Store
  • Video Library
  • Laminators
  • Sublimation Printers
  • Award Makers
  • Get Pricing
  • Contact Us
  • Register Your Printer
  • Refer A Friend

Contact Us

Mailing Address PO Box 68, Davidson, NC 28036
Physical Address 197 Byers Creek Rd, Suite C
Mooresville, NC 28117
Phone 866-788-7900
Fax 973-553-5427
Email sales@posterstudioexpress.com

Our Brands

  • Red Circle Solutions
  • PosterPrinters.co
  • School App Express

Corporate

  • About Us
  • Privacy Policy
  • Terms Of Use
  • Store Policies
© 2026 Red Circle Solutions LLC D.B.A. Poster Studio Express. All rights reserved.
Page load link
Added to cart