Free Graphic Organizers & Anchor Charts
What is a graphic organizer?
A graphic organizer is a visual framework, such as a Venn diagram or KWL chart, that helps students sort, connect and remember ideas. Teachers use them to plan writing, compare concepts, build vocabulary and track what a class has learned. Each sheet below is set out so students know where things go.
Popular:Venn diagramKWL chartFrayer modelPlot diagramStory map
Browse by category
Start with what you want students to do.
- Compare and contrast109 designs · 4 typesTwo-Set Venn Diagram · Three-Set Venn Diagram · T-ChartBrowse
- Sequence, cycles and timelines340 designs · 13 typesSix-Event Timeline · Four-Step Sequence · Eight-Event Historical TimelineBrowse
- Cause and effect103 designs · 4 typesCause-and-Effect Chain · Scientific Root-Cause Analysis · Historical Causes and ConsequencesBrowse
- Vocabulary, phonics and grammar588 designs · 23 typesFrayer Model · Word, Definition, Example · Academic Word Usage LadderBrowse
- Story and reading700 designs · 27 typesFive-Stage Plot Mountain · Seven-Stage Plot Mountain · Five-Part Story MapBrowse
- Writing and speaking plans602 designs · 23 typesCompare-and-Contrast Writing Plan · Small-Moment Narrative Planner · Problem–Solution Writing PlanBrowse
- Inquiry and science thinking665 designs · 26 typesKWL Chart · KWHL Chart · KWLS ChartBrowse
- Math thinking1,045 designs · 40 typesFour-Place Value Chart · Compare Four Data Displays · Compare Three Function FamiliesBrowse
- History, civics and geography438 designs · 17 typesCivic Action Plan · Continuity and Change · Corroborating Three SourcesBrowse
- Goals, planning and reflection164 designs · 6 types3–2–1 Reflection · Break a Task into Six Steps · Five-Rung Goal LadderBrowse
- Classroom community and SEL519 designs · 20 typesControl, Influence, Concern · Decision Balance Scale · Discussion AgreementsBrowse
- Brainstorm, sort and organize386 designs · 15 typesSix-Branch Brainstorm Web · Blank Anchor Chart · Eight-Branch Brainstorm WebBrowse
Popular organizers
The types people search for most.
- Two-Set Venn Diagram
- Three-Set Venn Diagram
- Five-Stage Plot Mountain
- Seven-Stage Plot Mountain
- Frayer Model
- T-Chart
- Five-Part Story Map
- Six Story Elements
- KWL Chart
- KWHL Chart
- KWLS Chart
- Six-Event Timeline
Browse all organizers
Filter by category, subject or type, or search by name.
- Two-Set Venn Diagram
- Three-Set Venn Diagram
- Five-Stage Plot Mountain
- Seven-Stage Plot Mountain
- Frayer Model
- T-Chart
- Five-Part Story Map
- Six Story Elements
- KWL Chart
- KWHL Chart
- KWLS Chart
- Six-Event Timeline
- Cause-and-Effect Chain
- Scientific Root-Cause Analysis
- Six-Branch Brainstorm Web
- Main Idea and Three Details
- Somebody–Wanted–But–So–Then
- Compare-and-Contrast Writing Plan
- Small-Moment Narrative Planner
- Four-Place Value Chart
- Problem–Solution Writing Plan
- Theme and Supporting Evidence
- Five-Paragraph Informative Plan
- Argument Claim, Evidence, Reasoning
No organizer matches that search. Try a shorter name, or clear the filters.
Free sheets
Where can I find free printable graphic organizers?
Right here: print any of these twelve blank, one-page graphic organizer templates free, right from this page. The Venn diagram comes in a two-circle and a three-circle version.
-
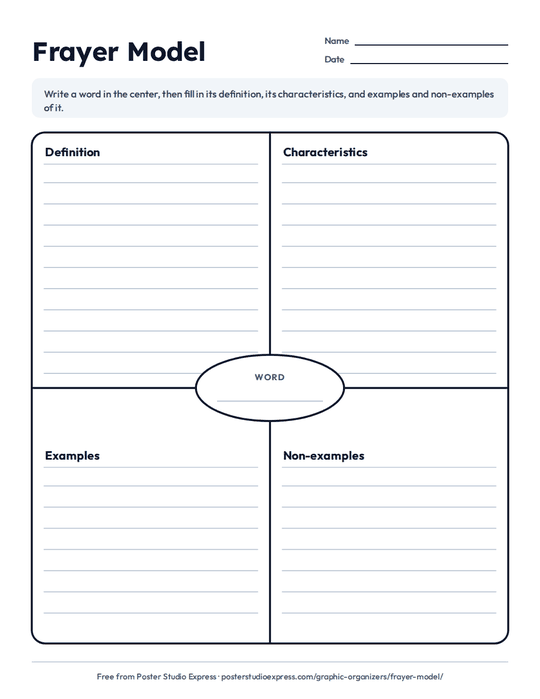
Frayer model
Learn a new word or concept
-
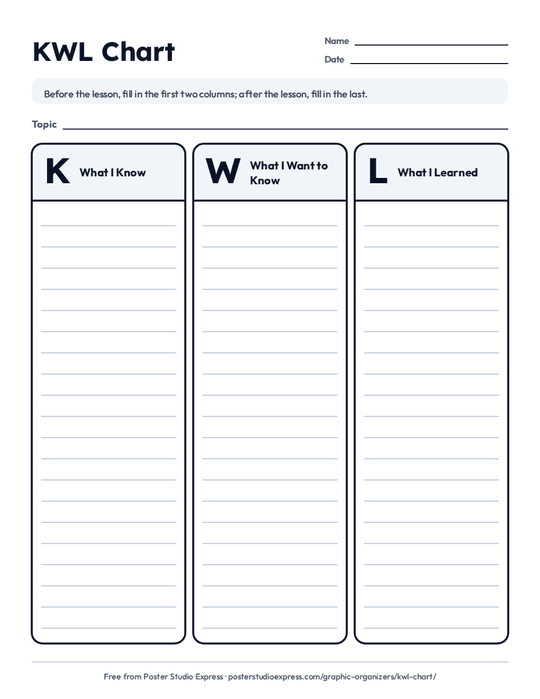
KWL chart
Know, want to know, learned
-
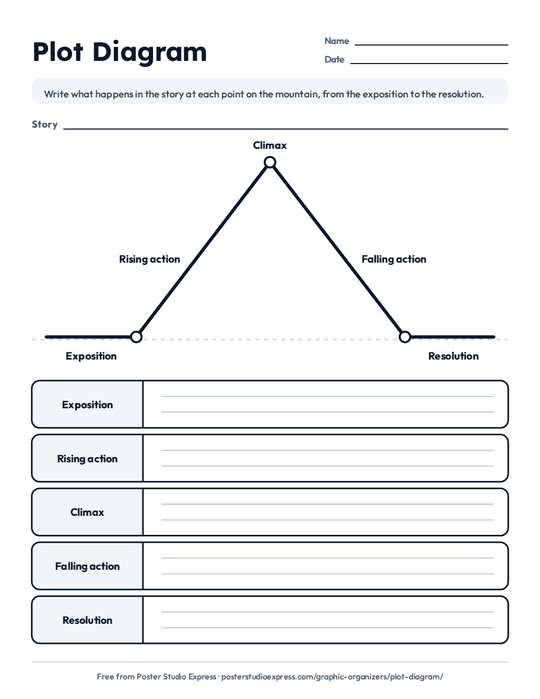
Plot diagram
See how a story builds
-
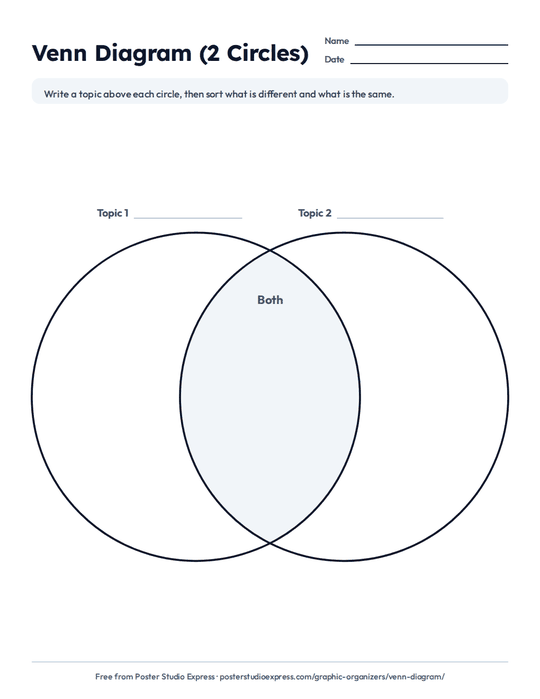
Venn diagram
Compare two or three things
-

Story map
Retell or plan a story
-
T-chart
List facts side by side
-
Cause and effect
Show what happened and why
-
Sequence chain
Put events in order
-
Main idea and details
Find the main idea
-
Compare-and-contrast chart
Compare feature by feature
-
Word map
Explore a word
-
5 Ws
Who, what, when, where, why


12 organizers · 13 pages (the Venn diagram has two) · US Letter (8.5 × 11 in)
Free to print and copy for classroom use · Free Use Terms
Free downloads for educators coming soon
Types
What are the different types of graphic organizers?
Graphic organizers are usually grouped by purpose. Here are twelve common types, what each is for, and the grades where each works well.
| Purpose | Organizer | What it is for | Works well in |
|---|---|---|---|
| Compare | Venn diagram | Seeing what two or three things share and how they differ | K–12 |
| T-chart | Listing facts about two topics side by side, such as pros and cons | K–12 | |
| Compare-and-contrast chart | Comparing two things feature by feature | 3–12 | |
| Vocabulary | Frayer model | Learning a concept through its definition, characteristics, examples and non-examples | K–12 |
| Word map | Exploring a word’s definition, synonyms, antonyms and use in a sentence | 2–8 | |
| Stories and reading | Story map | Recording a story’s characters, setting, problem, events and solution | K–12 |
| Plot diagram | Tracing how a story’s tension builds and releases | K–12 | |
| Sequence chain | Putting events or steps in order | K–8 | |
| Main idea and details | Finding a text’s main idea and the details that support it | 2–12 | |
| Inquiry | KWL chart | Activating prior knowledge and tracking what is learned | K–12 |
| 5 Ws | Gathering who, what, when, where and why about an event or text | 1–8 | |
| Cause and effect | Cause and effect | Showing what happened and why | 2–12 |
What are some types of graphic organizers that are suitable for elementary school students?
For elementary students, start with a Venn diagram, T-chart, story map, sequence chain or KWL chart, which all work from kindergarten. The Frayer model and plot diagram also work in the early grades, with pictures and a simple beginning, middle and end. Add the 5 Ws from grade 1; the word map, main idea and details, and cause and effect from grade 2; and the compare-and-contrast chart from grade 3.
Choose
Which graphic organizer should I use?
Start with what you want students to do, then pick the organizer built for it.
| If you want students to… | Try |
|---|---|
| Compare two or three things | Venn diagram, or a T-chart for a simple list |
| Compare features of two things in a grid | Compare-and-contrast chart |
| Learn a new word or concept | Frayer model |
| Explore the meaning of a word | Word map |
| Show what they know and what they learned | KWL chart |
| Retell or plan a story | Story map |
| See how a story builds to its climax | Plot diagram |
| Put events or steps in order | Sequence chain |
| Find the main idea of a text | Main idea and details |
| Show what caused something | Cause and effect |
| Gather the key facts about an event | 5 Ws |
Anchor charts
What are the differences between an anchor chart and a graphic organizer?
A graphic organizer is a framework each student fills in, while an anchor chart is a class poster that keeps a lesson on the wall. They meet when an organizer is printed poster-size and filled in together as a class.
Can you print graphic organizers poster-size?
Print it at 24×36. Any sheet here prints poster-size too. Printed poster-size, an organizer becomes a class anchor chart everyone can see and add to throughout the unit. A school poster maker prints it for as low as $1.30 per 24×36 poster.
Questions
What do teachers ask about graphic organizers?
What are the 7 types of graphic organizers?
There is no official list of seven types of graphic organizers, and different sources group them differently. Grouped by purpose, the common families are comparing (Venn diagram, T-chart, compare-and-contrast chart), vocabulary (Frayer model, word map), stories and reading (story map, plot diagram, sequence chain, main idea and details), inquiry (KWL chart, 5 Ws) and cause and effect. The table above lists twelve of them.
How do I use a graphic organizer step-by-step?
Pick the organizer that matches your goal, show one filled-in example, then let students fill in their own before, during or after reading. Use the table above to choose. Model one together on the board, then let students work alone or in pairs. Finish by using the filled-in organizer to talk or write.
What are the benefits of using graphic organizers?
Graphic organizers help students see how ideas relate, so information is easier to sort and connect. A 2004 review of 21 studies found that using graphic organizers was associated with improved reading comprehension for students with learning disabilities, though the initial gains were not seen on later comprehension tasks.1 Teach students how to fill one in before they use one alone.
Can you give me 10 examples of graphic organizers?
Yes. Ten common examples are the Venn diagram, T-chart, KWL chart, Frayer model, word map, story map, plot diagram, sequence chain, main idea and details, and cause and effect.
Where can I find free graphic organizer templates for writing?
Right here: the sheets above print free, and several suit writing. Use a story map or plot diagram to plan a narrative, main idea and details to plan an informational piece, a T-chart or compare-and-contrast chart to plan a comparison, and cause and effect to plan an explanation.
Do I need an account?
No account and no password. Browse, preview and print free.
Can I print them poster-size?
Yes. Any sheet here prints poster-size too, on a school poster maker. The print block above has the details.
Need an editable version?
The sheets are print-and-write: print one and fill it in by hand, or project it and fill it in together. To type instead, rebuild the layout in a Google Docs or Word table,2 or follow the steps for drawing circles on the Venn diagram page.
Sources
- Ae-Hwa Kim, Sharon Vaughn, Jeanne Wanzek and Shangjin Wei, “Graphic Organizers and Their Effects on the Reading Comprehension of Students With LD: A Synthesis of Research,” Journal of Learning Disabilities 37(2), 105–118 (March 2004). The review covers 21 group-design studies found in a literature search from 1963 to June 2001. DOI: https://doi.org/10.1177/00222194040370020201
- Google Docs Editors Help, “Add and edit tables”: https://support.google.com/docs/answer/1696711