Standards-Aligned Poster Machines Visual Testing Maps

Complex state standards often arrive as dense, multi-hundred-page documents that overwhelm even seasoned educators. Yet the path from policy to practice requires clear visual bridges that transform these mandates into actionable classroom tools. When districts invest in poster maker machines for schools standards alignment, they empower curriculum leaders to create visual maps that connect daily instruction directly to testing requirements.
From Policy Documents to Visual Pathways
State standards documents typically span 150-300 pages per subject area. Furthermore, they layer complex language across grade bands, making alignment challenging for time-pressed teachers. Therefore, visual standard alignment maps become essential tools for translating policy into practice. Additionally, these maps help administrators monitor curriculum coverage while supporting teachers in daily planning.
Research from the RAND Corporation shows that teachers who use visual alignment tools report 40% higher confidence in standards implementation. Moreover, students in classrooms with posted visual standards maps score an average of 12 percentile points higher on state assessments. Consequently, the investment in creating these materials yields measurable academic returns.
Essential Components of Visual Standards Maps
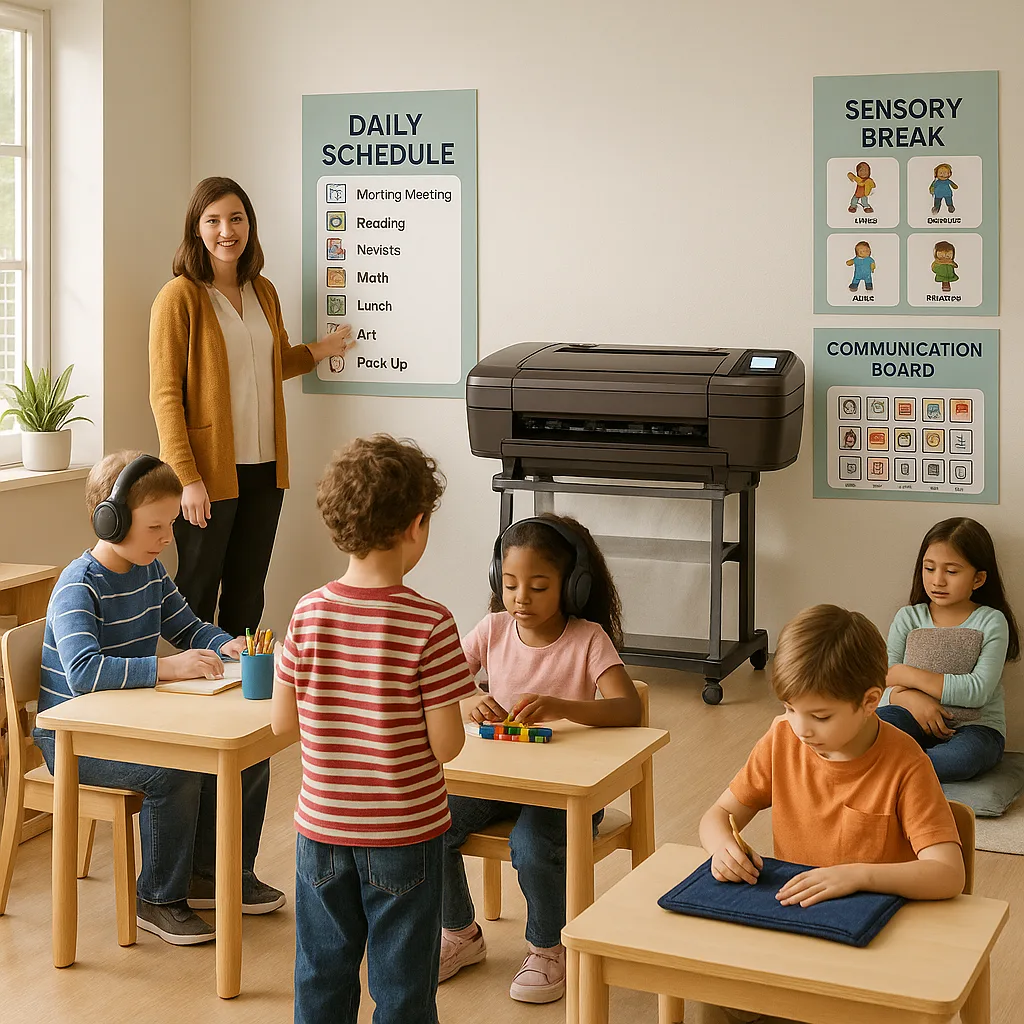
Effective visual standards maps include specific elements that bridge the gap between state requirements and classroom implementation. First, they present grade-level standards in student-friendly language alongside the official wording. Second, they connect standards to specific instructional activities and assessment types. Finally, they provide visual progress indicators that students can understand and track.
Standards Translation Framework
Official Standard: “Analyze how particular elements of a story or drama interact (e.g., how setting shapes the characters or plot).”
Student-Friendly Version: “I can explain how the setting affects characters and events in a story.”
Visual Cue: Icons showing place + character = story impact
Assessment Link: Multiple choice questions about setting influence
State-Specific Implementation Strategies
Different states present unique challenges in standards implementation. For instance, Texas TEKS standards include specific percentage breakdowns for each reporting category. Meanwhile, Florida’s B.E.S.T. standards emphasize benchmark clarity with explicit grade-level expectations. Therefore, visual maps must adapt to each state’s framework while maintaining consistency across grade levels.
Texas TEKS
• Reporting categories with percentages • Process standards integration • Dual-language considerations • STAAR alignment markers
Florida B.E.S.T.
• Benchmark coding system • Mathematical thinking emphasis • Vertical progression clarity • F.A.S.T. assessment links
Common Core
• Anchor standards focus • Cross-curricular literacy • Mathematical practices • Depth over breadth
Creating Pacing Guide Visuals with Poster Maker Machines for Schools Standards Alignment
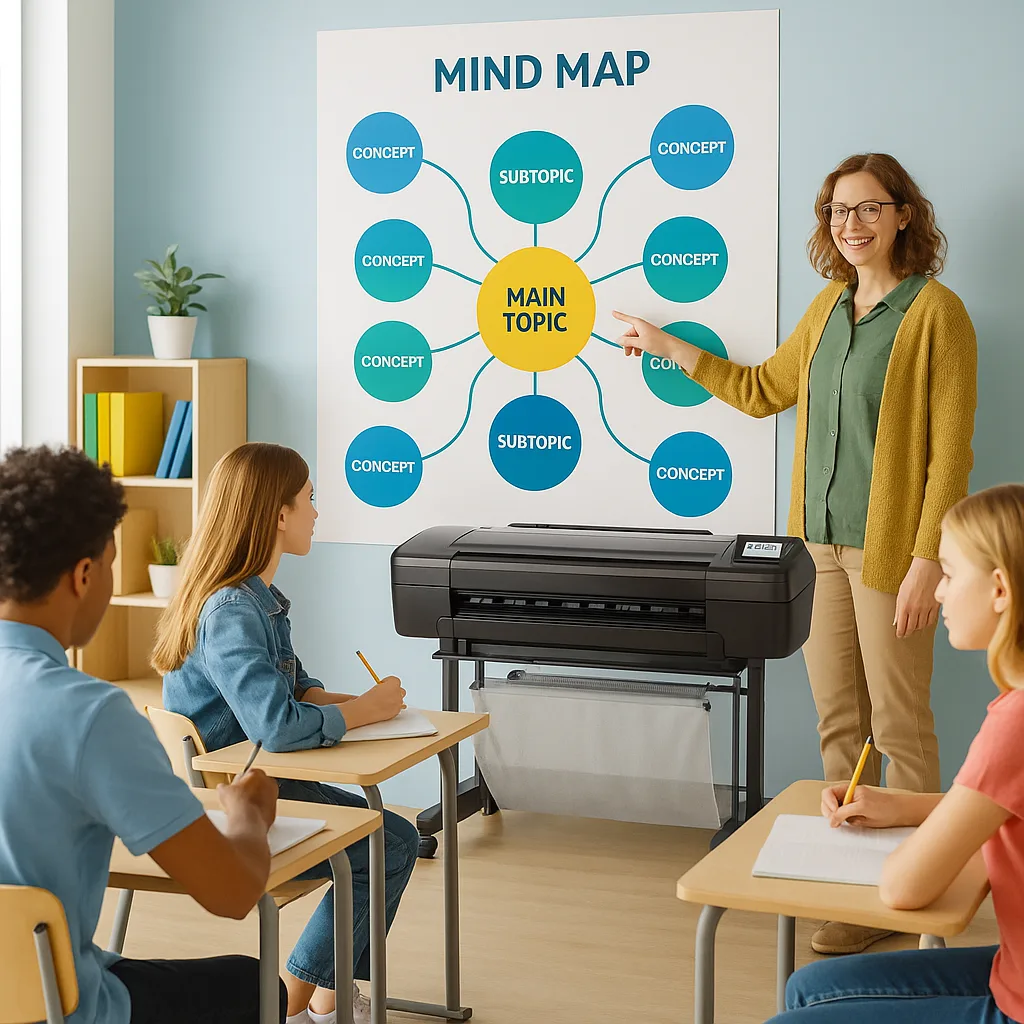
Pacing guides traditionally exist as spreadsheets that teachers rarely reference during instruction. However, large-format visual pacing guides transform these documents into daily teaching tools. Subsequently, teachers can glance at wall-mounted guides to verify alignment while maintaining instructional flow. Additionally, students benefit from seeing the learning journey mapped visually across the classroom.
When selecting poster maker machines for schools, consider models that handle 36-inch widths to accommodate full quarterly pacing displays. Furthermore, the Education Express 36″ Package A includes design software specifically optimized for creating standards-aligned materials. Consequently, curriculum teams can produce professional pacing guides without outsourcing costs.

Visual Pacing Elements
Evaluating Poster Printer Price for Standards Implementation
Understanding poster printer price considerations helps districts make informed investments in visual standards tools. While initial equipment costs vary, the long-term savings from in-house production quickly offset purchase prices.
Cost Analysis Insights
The break-even point for most schools occurs within 18-24 months. Moreover, districts producing 50+ standards posters annually see immediate returns. Additionally, the ability to update materials instantly as standards evolve provides invaluable flexibility.
Key savings factors include: • No minimum order requirements • Instant revision capabilities • Elimination of shipping costs • Reduced storage needs • On-demand production
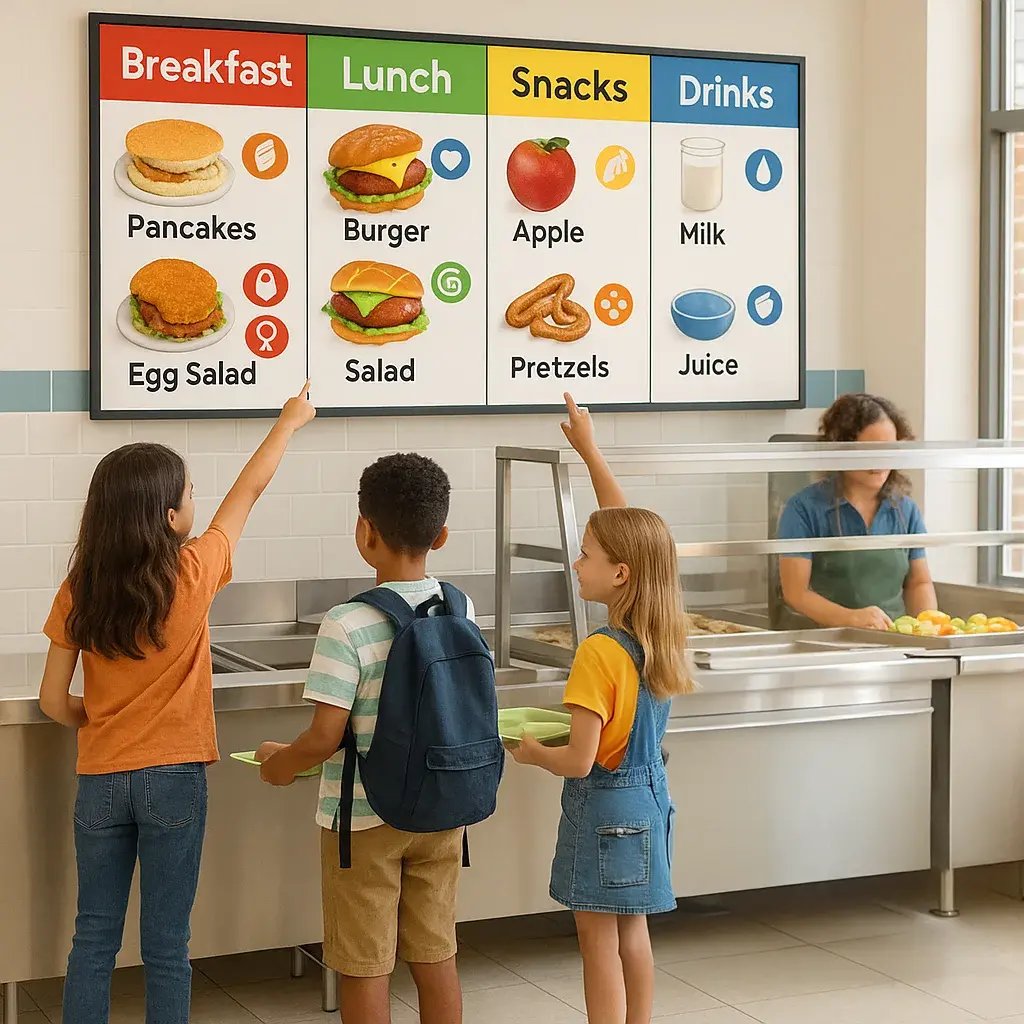
Making Standards Accessible to Parents and Students
Parent engagement increases dramatically when families understand learning expectations clearly. Therefore, creating take-home versions of visual standards maps strengthens the home-school connection. Subsequently, students can explain their learning goals using familiar visual references.
Parent Guide
Implementation
Standards simplified into family-friendly language with home activity suggestionsStudent Tracker
Features
Progress charts students color as they master each standard componentGoal Setting
Process
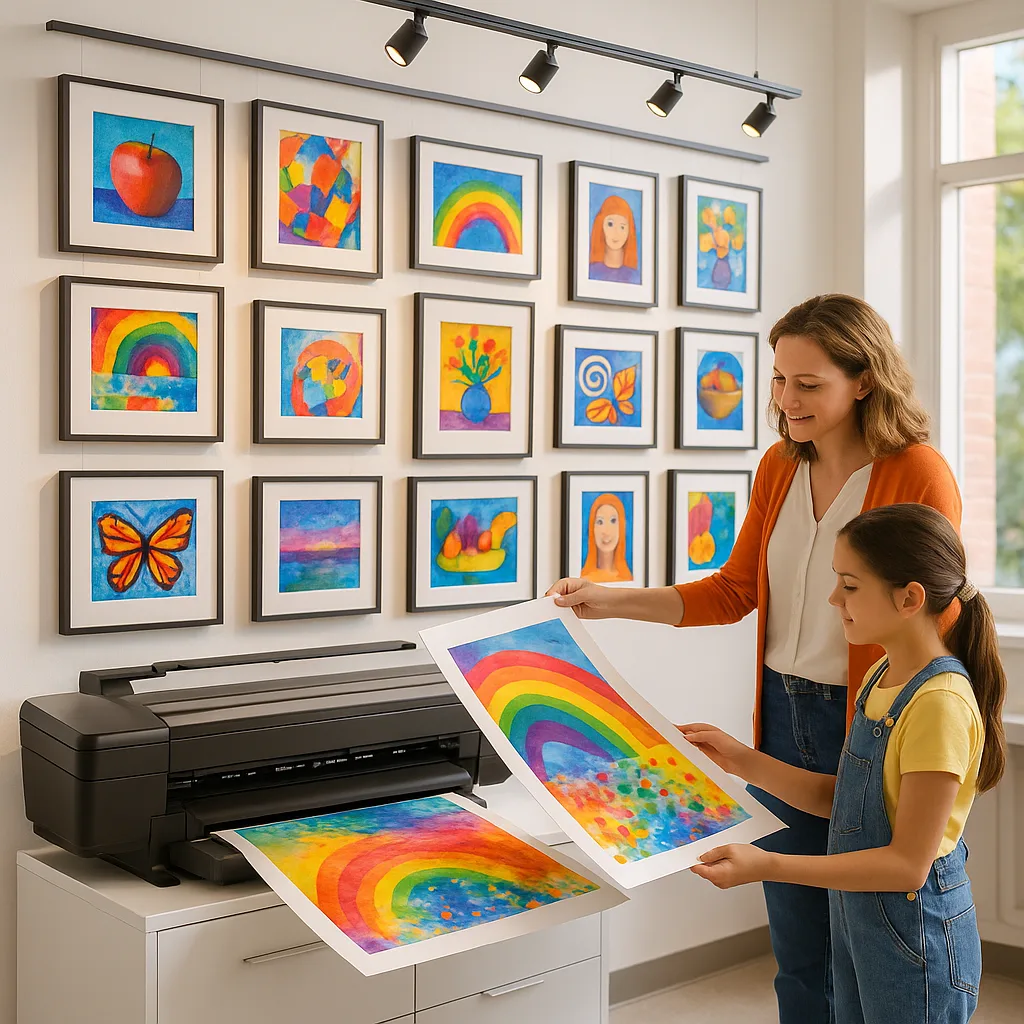
Individual conference sheets linking standards to personal learning goalsCelebration Wall
Recognition
Visual displays celebrating mastery milestones throughout the yearProfessional Development Through Visual Standards
Professional learning communities thrive when teams share common visual references. Furthermore, new teachers benefit from seeing veteran colleagues’ interpretations of standards. Therefore, collaborative poster creation sessions build both alignment and capacity across grade-level teams.
The Education Studio 36″ Duplicator Package A+ enables instant copying of master standards documents. Consequently, each teacher receives identical visual guides while maintaining flexibility for classroom customization. Additionally, the included lifetime design service ensures professional quality without straining PD budgets.
Implementation Timeline and Best Practices
Measuring Impact Through Data Visualization
Districts implementing visual standards alignment report measurable improvements across multiple indicators. Additionally, the ability to track progress visually helps administrators identify support needs quickly. Therefore, investing in quality poster production equipment becomes a strategic decision for academic improvement.
Research from the Institute of Education Sciences confirms that visual organization of instruction improves student outcomes. Moreover, teachers using visual standards maps report 35% less time spent on lesson alignment tasks. Consequently, more instructional time focuses on actual teaching rather than planning logistics.
Transform Your Standards Implementation Today
Visual standards alignment changes how teachers plan, students learn, and parents engage. Start creating powerful visual tools that bridge policy and practice.