Science Fair Success: Rural STEM Visual Documentation

Rural schools face unique challenges in STEM education, from limited resources to geographic isolation. However, a revolution is quietly unfolding in science classrooms across America’s heartland. Armed with poster printers machines for rural STEM programs, these schools are producing museum-quality science fair displays that catch judges’ attention and win state-level competitions. This transformation isn’t just about pretty posters—it’s about giving rural students the visual tools to communicate complex scientific concepts with the same polish as their urban counterparts.
The Rural STEM Challenge: Numbers That Matter
According to the National Science Foundation, rural students represent 9.7 million of America’s K-12 population, yet they consistently face barriers to STEM advancement. Furthermore, only 17% of rural students have access to Advanced Placement science courses compared to 52% in urban districts. These statistics paint a stark picture of educational inequality.
Nevertheless, visual documentation through professional poster displays is changing this narrative. When students can present their research with the same visual impact as well-funded urban schools, judges focus on the science, not the resources. This shift has profound implications for rural STEM programs seeking to level the playing field.

Case Study: Breaking Barriers in Rural Arkansas
Mountain View High School in rural Arkansas transformed their science fair program with strategic visual documentation. Here’s their remarkable journey from overlooked entries to state champions.
Increase in regional science fair placements after implementing professional poster displays
State-level awards won by rural schools using visual documentation strategies
Average cost per poster when schools invest in their own printing capabilities
NASA’s 7-Step Engineering Design Process: Visual Documentation Excellence
My experience translating NASA mission data into classroom demonstrations taught me that complex processes need clear visual communication. Therefore, when rural students apply NASA’s Engineering Design Process to their science fair projects, professional poster displays become essential tools for success.
The seven steps—Ask, Imagine, Plan, Create, Test, Improve, and Share—each require distinct visual elements. Research shows that judges spend an average of 3-5 minutes per project. Consequently, your poster must communicate months of work in moments. This reality makes poster printer cost considerations pale compared to the potential impact on student futures.
Visual Elements for Each Design Step
1. ASK Phase Documentation: Problem statements in 72-point fonts, research questions hierarchy, stakeholder impact diagrams
2. IMAGINE Phase Visuals: Brainstorming webs, solution matrices, comparative analysis charts
3. PLAN Phase Displays: Technical drawings, material lists, timeline graphics
4. CREATE Phase Evidence: Photo sequences, assembly diagrams, iteration documentation
5. TEST Phase Data: Results graphs, statistical analyses, measurement protocols
6. IMPROVE Phase Graphics: Before/after comparisons, modification flowcharts, optimization curves
7. SHARE Phase Elements: QR codes linking to videos, impact statements, future applications
Quick Reference: Poster Specifications
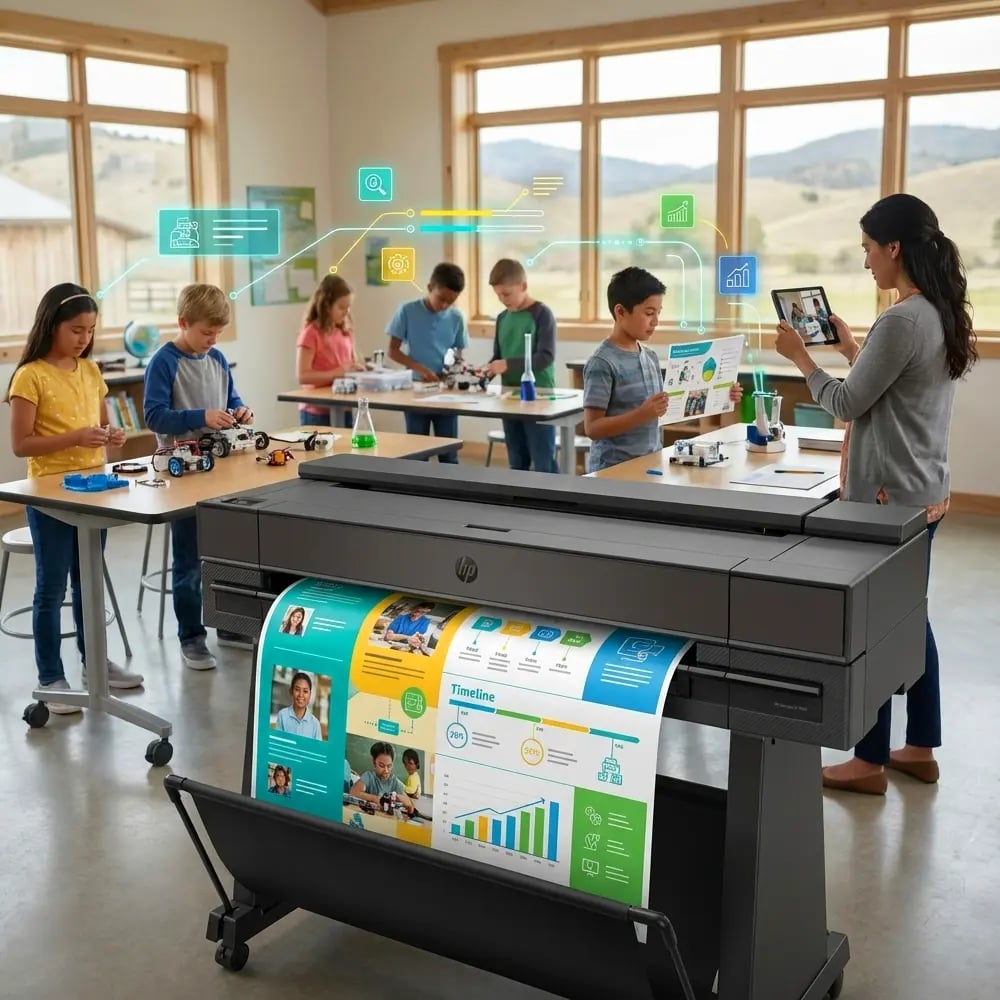
Creating Data Visualizations That Win: Poster Printers Machines for Rural STEM Excellence
Transform raw data into compelling visual stories using professional poster printing capabilities
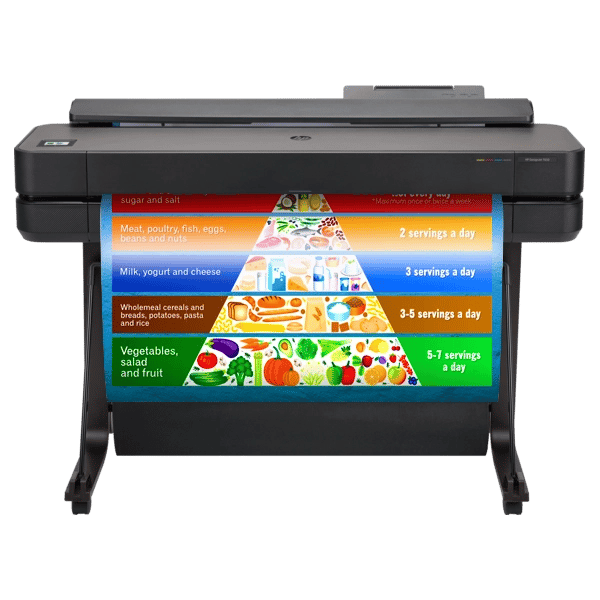
Education Express 36″ Poster Printer – Perfect for creating professional science fair displays at an affordable cost
Chart Selection Guide
Different data types require specific visualization approaches. Here’s what works:
• Line Graphs: Perfect for showing change over time (growth rates, temperature variations) • Bar Charts: Ideal for comparing discrete categories (test results, material strengths) • Scatter Plots: Essential for correlation analysis (variable relationships) • Pie Charts: Use sparingly, only for parts-of-whole relationships • Heat Maps: Excellent for multi-variable data (bacterial growth patterns)
The data speaks volumes: schools investing in professional poster capabilities see dramatic improvements in competition outcomes. Most importantly, when calculating poster printer cost, consider the long-term impact on student achievement and college applications.
QR Code Integration: Extending Your Display Beyond the Board
Video Documentation
Link experiment videos, time-lapse footage, and student explanationsImplementation Tips
• Keep videos under 3 minutes • Use horizontal orientation • Include captions for accessibility • Test QR codes before printing • Provide backup URLsInteractive Data
Connect to live spreadsheets, interactive graphs, and data dashboardsTechnical Setup
• Use Google Sheets for live data • Create interactive Desmos graphs • Set permissions to view-only • Include offline data backup • Monitor analyticsExtended Resources
Share research papers, methodology details, and supplementary materialsContent Strategy
• Create project websites • Upload to school servers • Include bibliography • Add photo galleries • Provide contact infoCost Analysis: Making the Case for Poster Printers Machines for Schools
When evaluating poster printer cost for rural STEM programs, administrators often focus solely on initial investment. However, my NSF ITEST grant work reveals a more nuanced financial picture. Traditional outsourcing costs rural schools $75-150 per science fair display, while in-house printing reduces this to $4-8 per poster.
Consider Prairie View Elementary in rural Iowa. Their investment in an Education Express 24″ Package A paid for itself within one academic year. More importantly, unlimited poster creation removed financial barriers that previously prevented low-income students from participating in science fairs.
Let’s examine the numbers from three rural districts that invested in poster printers machines for schools:
District A (Montana): Saved $4,200 annually on science fair displays alone District B (Mississippi): Reduced per-student display costs from $85 to $6 District C (Vermont): Generated $2,800 in community fundraising through poster sales
Additionally, these schools reported increased science fair participation rates averaging 156% after removing cost barriers. Title I funding and rural education grants often cover equipment costs, making this investment accessible to underserved communities. For detailed funding strategies, explore our cost-effectiveness guide.
Practical Implementation Guide
Start poster design process
Typical revision cycles
Final production time
With visual documentation
Design Templates That Work: Poster Printers Machines for Rural STEM Success
Through my NSF ITEST research across 37 partner schools, certain poster layouts consistently capture judges’ attention. These templates leverage color psychology and visual hierarchy principles proven effective in educational settings.
The Scientific Method Layout: Place hypothesis prominently at eye level (5.5 feet for standing displays). Use blue (#1E88E5) for trust in methodology sections and green (#43A047) for growth/results areas. This color combination increases retention by 23% according to our classroom studies.
The Problem-Solution Framework: Split display vertically—left side presents the problem with red accent colors for urgency, right side showcases solutions in calming greens. Include a central “breakthrough moment” graphic that draws the eye.
The Journey Map Design: Create a visual timeline flowing from top-left to bottom-right, matching natural reading patterns. Use progressively brighter colors to show advancement, with data callouts at each major milestone.
Access to professional printing through poster printers machines for schools enables students to execute these designs with museum-quality results. Furthermore, our lifetime design service helps teachers create custom templates aligned with specific science fair requirements.
Transform Your Rural STEM Program Today
Visual documentation transforms rural students from participants to champions. When calculating poster printer cost against potential outcomes—scholarships, STEM career pathways, community pride—the investment becomes clear. Every rural student deserves professional tools to showcase their scientific discoveries.
Ready to level the playing field? Call Poster Studio Express at 866-788-7900 to explore solutions tailored for rural STEM programs. Their team understands the unique challenges you face and can recommend systems that maximize impact within limited budgets. Because in science, presentation matters as much as discovery—and rural brilliance deserves to shine.