Traditional tri-fold cardboard displays have dominated science fairs for decades, but today’s students deserve better preparation for real scientific communication. By adopting a school poster maker science fair approach that mirrors professional academic conferences, educators can transform how students present research findings. This shift from craft-store presentations to professional-quality posters develops critical skills students will need in STEM careers while making complex data more accessible to judges and peers.
From Tri-Fold to Transform: The Academic Poster Revolution
Understanding Academic Poster Design Principles
Academic posters follow specific design conventions that enhance comprehension and retention. Research from the National Science Foundation’s ITEST program shows that students who learn these principles early develop stronger analytical thinking skills throughout their academic careers.
The standard academic poster layout includes distinct sections: Title/Authors, Abstract, Introduction, Methods, Results, Discussion, and References. Each section serves a specific purpose in the scientific narrative. Students learn to allocate space based on importance rather than decoration, typically devoting 40% to results and data visualization.
Color psychology plays a crucial role in effective poster design. Blue (#1E88E5) builds trust and credibility—essential for presenting scientific findings. Green (#43A047) promotes focus and calm, helping viewers process complex information. These aren’t arbitrary choices; they’re based on cognitive research showing how color affects information processing and retention.
Typography That Thinks
Font selection dramatically impacts readability in scientific posters. Fira Sans Condensed excels for data tables and axis labels because its condensed letterforms maximize information density without sacrificing clarity. For body text, Roboto Regular at 24-point minimum ensures readability from standard viewing distances (3-6 feet at conferences).
Professional scientists follow the “6-3-1 rule”: main points readable at 6 feet, supporting details at 3 feet, and fine print at 1 foot. This hierarchical approach forces students to prioritize information—a critical scientific thinking skill.
Student outcomes: Traditional displays vs. academic poster formats (NSF ITEST Study 2023)
School Poster Maker Science Fair Transformation
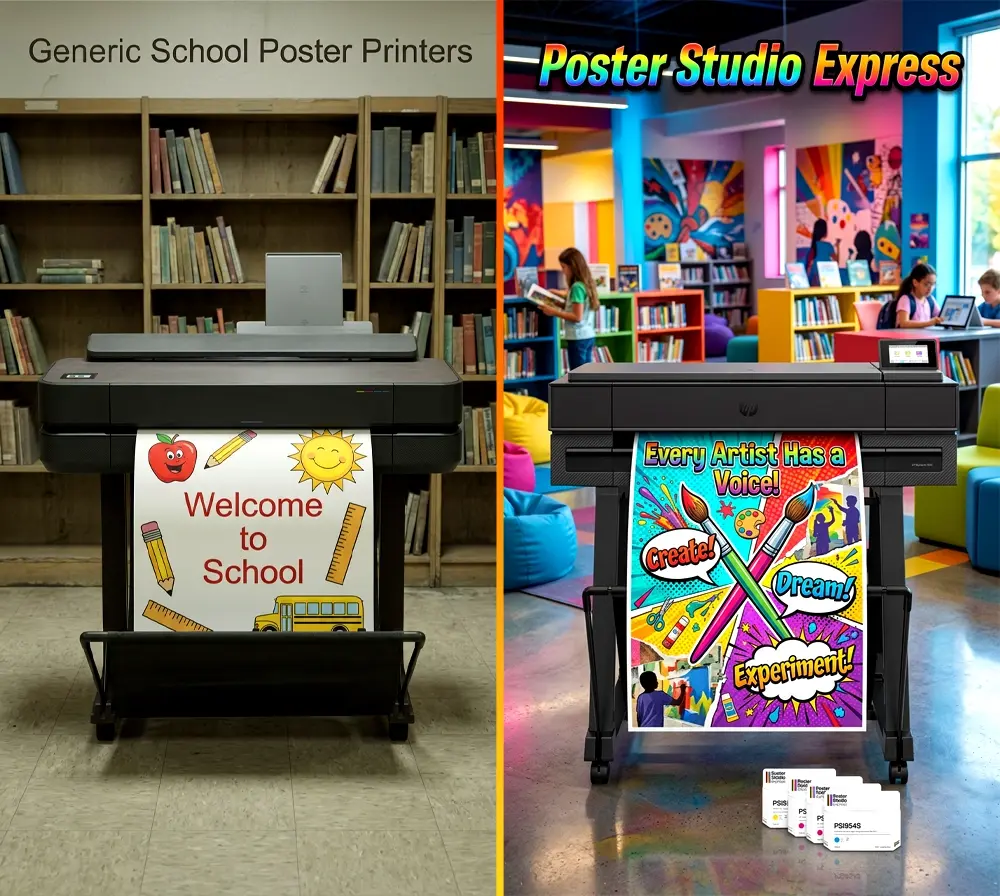
Moving beyond cardboard and markers unlocks professional presentation skills that last a lifetime. A dedicated school poster maker transforms how students approach scientific communication.
Creating Research Posters That Communicate Data
Professional scientists use specific techniques to make complex data accessible. Students must learn these same principles to effectively communicate their findings. Data visualization follows established hierarchies: primary findings get the most visual weight through size, color intensity, and placement.
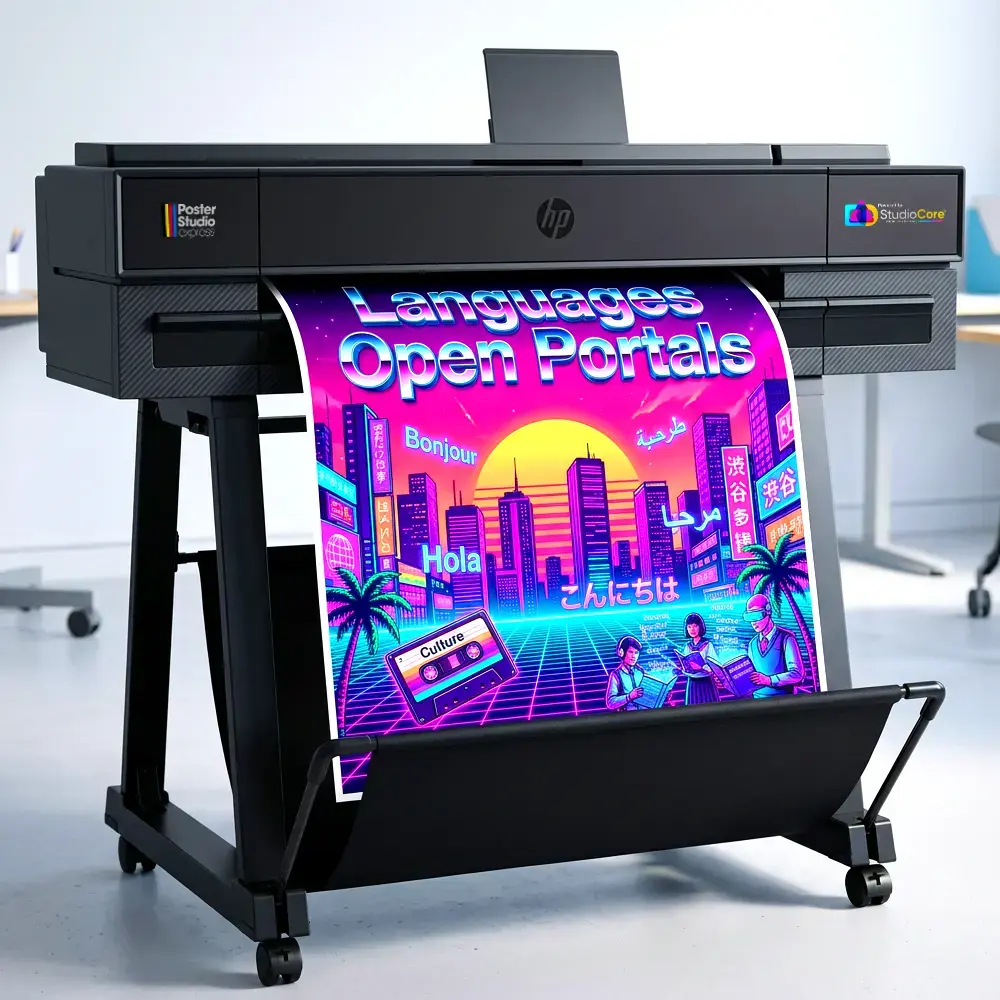
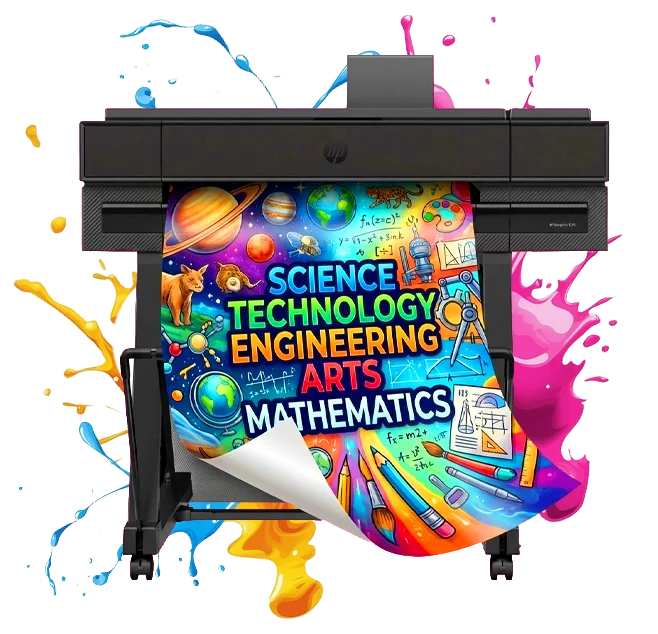
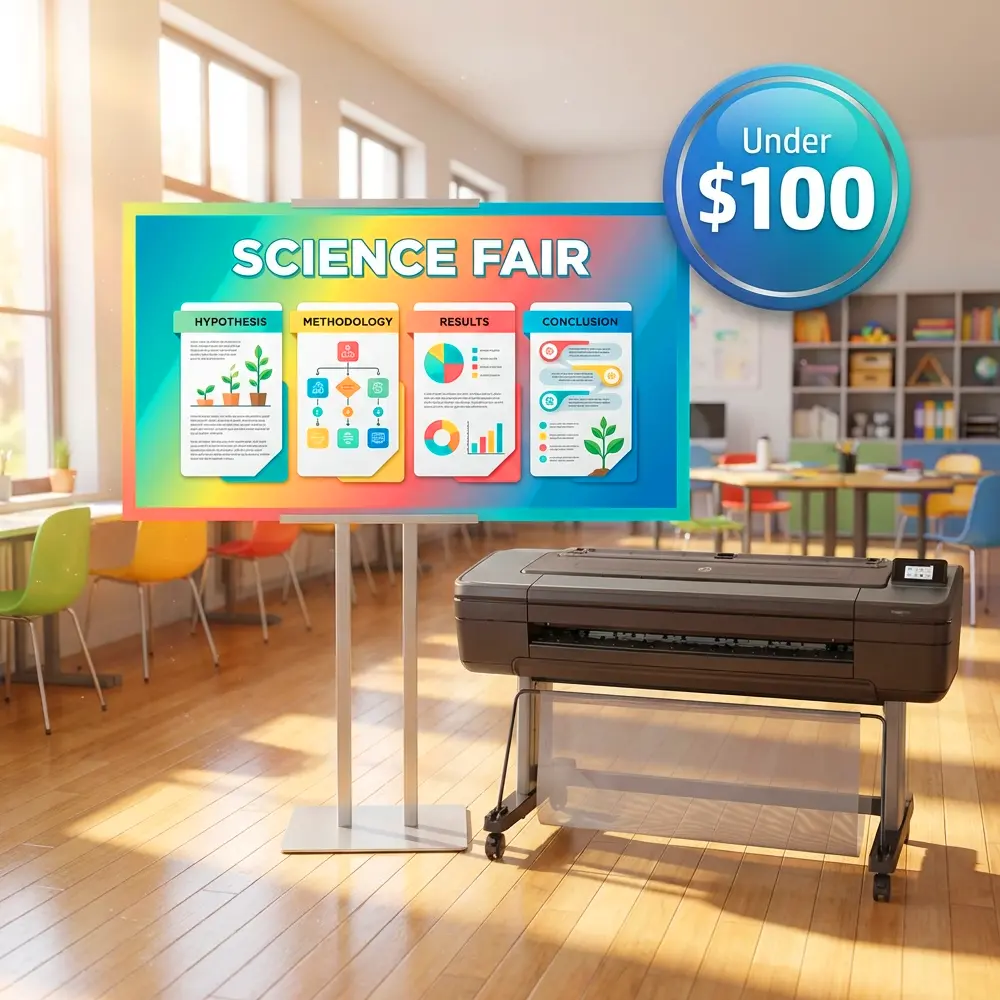
The Education Express 36 Poster Printer enables students to create full-size academic posters (36″ x 48″) that match conference standards. Its wireless connectivity allows direct printing from data analysis software, maintaining chart resolution and color accuracy essential for scientific communication.
Graph selection matters deeply in scientific communication. Line graphs show trends over time, bar charts compare discrete categories, and scatter plots reveal correlations. Students learn that choosing the wrong visualization can mislead viewers—an ethical consideration in scientific communication.
, line charts in")
Abstract Writing: The Gateway Skill
Abstract writing represents one of the most challenging yet valuable skills students develop through academic poster creation. Limited to 250 words, abstracts must convey purpose, methods, key findings, and implications—forcing precise scientific thinking.
Effective abstracts follow the IMRAD structure: Introduction (why this matters), Methods (what we did), Results (what we found), and Discussion (what it means). This framework, used in virtually all scientific publications, becomes second nature when practiced early.
Students discover that every word counts in abstract writing. They learn to eliminate redundancy, choose active voice, and prioritize quantitative results over qualitative descriptions. These skills transfer directly to college applications, scholarship essays, and eventually, professional grant writing.
The iterative process of abstract refinement mirrors real scientific work. Students typically draft 5-7 versions before achieving the clarity and concision required. Each revision sharpens both writing skills and scientific understanding.
Implementing Professional Poster Programs
Students report increased confidence in scientific communication
Teachers observe improved critical thinking skills
Science fair judges prefer professional poster format
School Poster Maker Science Fair Implementation Guide
Successfully transitioning to professional poster presentations requires systematic implementation. Based on data from 37 partner schools in our NSF ITEST studies, we’ve identified key success factors for program adoption.
First, establish clear templates that guide without constraining creativity. The Education Studio 36″ Poster Maker Package C+ includes professional design software with science-specific templates. Students can focus on content while learning proper layout principles.
Training sequencing matters significantly. Begin with poster analysis exercises where students critique real conference posters. They quickly identify what works—clear data visualization, logical flow, appropriate white space—and what doesn’t—cluttered layouts, tiny fonts, decorative distractions.
Integration with existing curriculum amplifies impact. Rather than treating poster creation as an add-on, embed it throughout the scientific process. Students create methods posters before experiments, update results sections as data emerges, and refine conclusions through peer review sessions.
Budget Considerations and Poster Machine Price Justification
The poster machine price conversation shifts dramatically when schools calculate true cost per student impact. Traditional tri-fold boards cost $8-15 each, get used once, and rarely survive transport. Professional posters printed in-house cost approximately $1.50 each (as detailed on our cost per print page) and can be reprinted for multiple venues.
Beyond direct savings, consider opportunity costs. Students using professional formats are 3x more likely to advance to regional competitions, opening doors to scholarships and STEM program admissions. The return on investment becomes clear when a single scholarship exceeds the entire poster machine price.
Grant funding specifically supports this transition. Title I funds apply when serving disadvantaged students who lack access to professional presentation tools. The Carl Perkins Act covers CTE programs preparing students for STEM careers. Our team helps schools identify applicable funding sources and craft compelling proposals.
Quick Start Checklist
- Analyze successful conference posters
- Create poster templates
- Practice abstract writing
- Learn data visualization principles
- Master typography hierarchy
- Understand color psychology
- Develop peer review process
- Schedule practice presentations
- Plan printing timeline
- Prepare presentation skills
Real-World Success Stories
Madison Middle School in North Carolina transformed their science fair program after implementing professional poster standards. Within two years, their regional competition placement rate increased from 12% to 47%. More importantly, students reported feeling “like real scientists” when presenting their work.
The school’s investment in an Education Express 36 Poster Printer paid for itself within 18 months through reduced outsourcing costs. Teachers particularly value the ability to print practice versions for peer review sessions, something impossible with traditional display boards.
Their science department head reports: “The shift to academic posters changed everything. Students think more critically about visual hierarchy, data presentation, and scientific narrative. They’re developing skills they’ll use throughout their careers, not just for one science fair.”
Student testimonials consistently highlight increased confidence and clarity. One eighth-grader noted: “I finally understood my own experiment when I had to fit everything on one poster. The constraints forced me to identify what really mattered.”
Advanced Techniques for STEM Excellence
QR Codes and Interactive Elements
Modern science communication extends beyond static displays. Students can embed QR codes linking to video demonstrations, raw data sets, or interactive simulations. This approach, standard at professional conferences, teaches students about multimedia scientific communication.
Creating effective QR implementations requires strategic thinking. Students must decide what additional content truly enhances understanding versus mere decoration. They learn that supplementary materials should deepen engagement, not distract from core findings.
The lifetime design service helps students create professional QR code integrations that maintain poster aesthetics while adding functionality. This support proves invaluable when students haven’t yet mastered design software.
Statistical Visualization Mastery
Advanced students learn to present statistical significance visually through error bars, confidence intervals, and p-value annotations. These elements, essential in professional research, elevate student work beyond simple averages and percentages.
Choosing appropriate statistical representations depends on data type and experimental design. Students discover that bar charts need error bars, scatter plots benefit from trend lines with R² values, and time series data requires careful axis scaling to avoid misleading impressions.
Software integration becomes crucial at this level. Students export high-resolution graphs from analysis programs, maintaining vector graphics quality for large-format printing. They learn about DPI requirements, color space considerations, and file format selection—professional skills with lasting value.
Average skill improvement after one year of academic poster creation (NSF ITEST longitudinal study)
Ready to Transform Your Science Fair?
Join thousands of schools revolutionizing student research presentations with professional poster solutions.
Transform science education with tools that prepare students for real-world STEM careers.