When schools invest in a poster maker for schools data walls, they unlock powerful ways to transform raw benchmark scores into inspiring visual narratives that motivate students while respecting privacy boundaries. The key lies in designing displays that celebrate growth trajectories rather than ranking individuals—a delicate balance that requires both pedagogical wisdom and thoughtful graphic design.
Creating Ethical Poster Maker for Schools Data Walls
The transformation from benchmark to billboard begins with understanding what makes data displays ethical and effective. Research from the National Center for Education Statistics shows that visual progress tracking increases student engagement by 34% when implemented with privacy safeguards. However, the same research warns against public comparison charts that can damage self-esteem and create counterproductive competition.
Modern educational psychology emphasizes growth mindset principles, which align perfectly with how a color poster maker for schools can visualize progress. Instead of fixed achievement levels, effective data walls showcase individual improvement trajectories using colors, symbols, and creative metaphors that maintain student anonymity while celebrating collective success.
 represent different skill")
Privacy-First Design Principles
Protecting student identity while celebrating achievement requires thoughtful design strategies
Use student-selected avatars or numbers instead of names on public displays
Display percentage improvements rather than absolute scores
Emphasize classroom-wide achievements and collaborative goals
Designing Motivational Data Displays with Poster Maker for Schools Data Walls
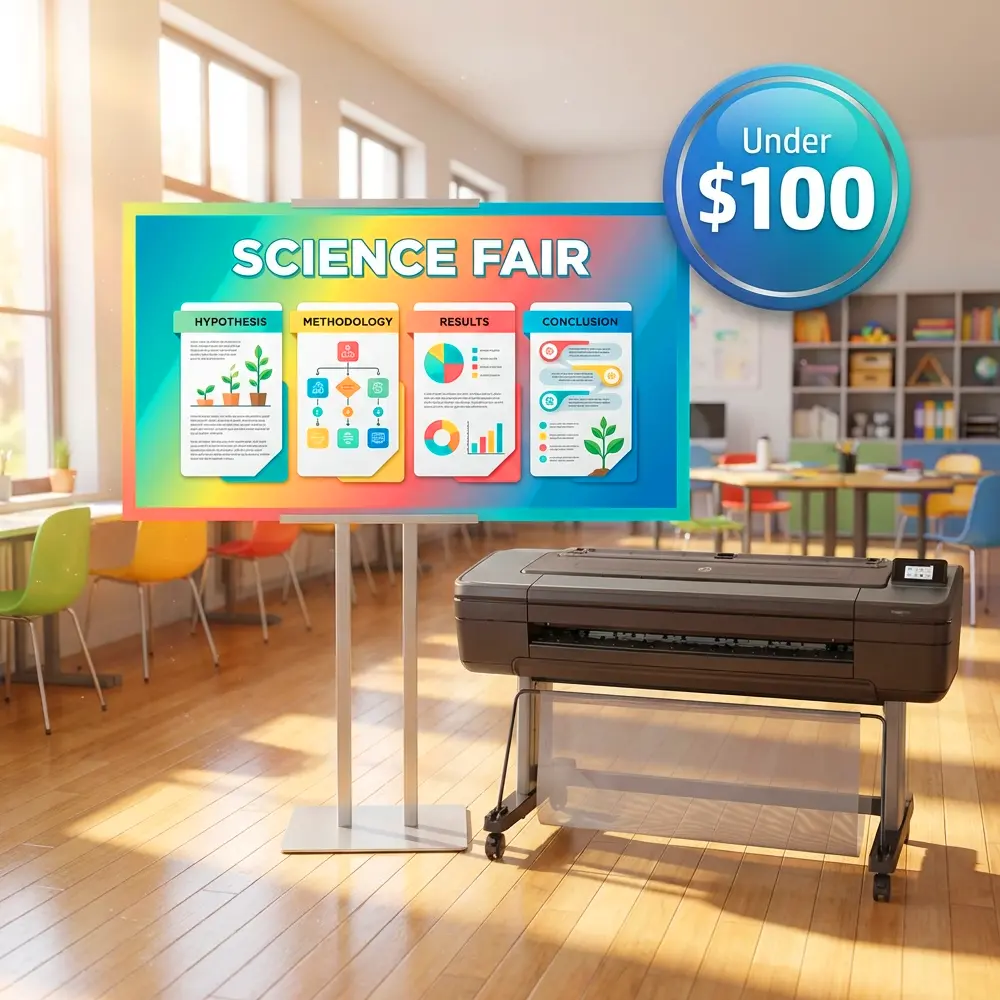
The Education Express 36 Poster Printer enables schools to create large-format data visualizations that transform sterile spreadsheets into engaging visual stories. Consider these evidence-based approaches:
Journey Maps Instead of Rankings Replace traditional leaderboards with individual journey maps showing each student’s path from starting point to current position. Using abstract symbols like rockets, mountains, or race tracks maintains anonymity while making progress tangible.
Color-Coded Growth Zones Implement a traffic light system where green represents mastery, yellow indicates approaching proficiency, and red signals areas needing support. This universal color language helps students quickly identify their focus areas without public score exposure.
Collaborative Class Thermometers Design large thermometer graphics tracking whole-class progress toward shared goals. As benchmark scores improve collectively, the mercury rises, fostering team spirit rather than individual competition.
Research from the Journal of Educational Psychology (2023) demonstrates that students exposed to growth-oriented visual displays show 28% higher intrinsic motivation compared to those in classrooms with traditional achievement charts. The key difference lies in how data is framed and presented.
A poster maker for schools equipped with versatile design software allows educators to experiment with various visualization metaphors. Some successful examples include:
• Garden growth charts where each plant represents a skill area • Space missions tracking progress through learning objectives • Adventure maps showing conquered territories of knowledge • Building blocks illustrating foundation skills supporting advanced concepts

Perfect for Data Walls
The Express 36 Poster Printer is an ideal choice for schools.
Implementation Strategies for Color Poster Maker for Schools
Successfully implementing data walls requires careful planning and consistent execution. Schools using a cost-effective poster printing solution can regularly update displays without budget concerns, maintaining fresh and relevant visualizations throughout the academic year.
Student Ownership Strategies
Empowering students to participate in their data visualization creates deeper engagement:
1. Personal Goal Setting Allow students to set individual targets and track progress using private folders or digital portfolios, then contribute anonymous success stories to class displays.
2. Student-Designed Visuals Involve learners in creating poster designs using tools like Canva, then print their creations with your Education Studio 24″ Package A+ for authentic ownership.
3. Reflection Journals Pair visual displays with written reflection prompts helping students articulate their learning journey beyond numbers.
4. Peer Recognition Systems Create spaces where students celebrate each other’s growth without revealing specific scores or grades.
Technical Considerations
Maximizing your poster maker investment requires understanding technical best practices:
Resolution Requirements Data visualizations need crisp lines and readable text. Export charts at 300 DPI minimum for professional results.
Color Psychology Use green for growth, blue for trust, and warm oranges for celebration. Avoid red except for urgent attention areas.
Update Frequency Plan weekly or bi-weekly refresh cycles to maintain engagement without overwhelming printer resources.
Material Selection Choose coated poster paper for vibrant colors that make data pop, or laminate high-traffic displays for durability.
Real-World Success Metrics
Schools implementing privacy-conscious data walls report significant improvements across multiple metrics, validating the ethical approach to student progress visualization.
Building Community Through Collective Visualization
The most successful data walls foster classroom community rather than competition. Using a versatile poster printing system, educators can create displays that unite students around common goals while respecting individual differences.
Consider implementing “Class Challenge” boards where the entire group works toward shared benchmarks. For instance, if 80% of students improve their reading fluency by one level, the whole class earns a celebration. This approach transforms data from a potentially divisive tool into a unifying force.
The 5-year warranty on most poster maker systems ensures schools can maintain these motivational displays long-term without worrying about equipment failure disrupting their data visualization programs.
Educational research consistently shows that students who can visualize their progress develop stronger metacognitive skills and self-regulation abilities. A study published in the Review of Educational Research (2024) found that classrooms using growth-oriented data displays saw:
• 42% increase in student self-efficacy scores • 31% improvement in goal-setting behaviors • 38% higher rates of academic persistence • 29% reduction in test anxiety
These improvements stem from shifting focus from performance comparison to personal growth trajectories. When students see their journey visualized through creative, anonymous displays, they internalize a growth mindset more effectively than through verbal encouragement alone.
Practical Implementation Timeline
Week 1-2
Planning Phase
Establish privacy protocols and design templates Survey students about visualization preferences and create initial mockups using your color poster maker for schools.Week 3-4
Design Phase
Create visual metaphors and test prints Work with students to develop anonymous tracking systems and print prototype displays for feedback.Week 5-6
Launch Phase
Introduce system to students and parents Host viewing sessions explaining privacy measures and growth focus while showcasing initial displays.Ongoing
Maintenance
Regular updates and celebrations Schedule bi-weekly print sessions to refresh displays and monthly celebrations of collective achievements.Conclusion: Empowering Growth Through Ethical Visualization
Transforming benchmark data into motivational displays represents a paradigm shift in how schools approach student progress tracking. By investing in a quality poster maker for schools, educators gain the tools to create visually compelling narratives that inspire rather than intimidate.
The journey from benchmark to billboard need not compromise student privacy or foster unhealthy competition. Through thoughtful design, anonymous tracking systems, and growth-focused metrics, data walls become powerful catalysts for learning community development. When students see their progress celebrated in creative, respectful ways, they develop the intrinsic motivation and self-awareness necessary for lifelong learning success.
As you embark on creating your own ethical data visualization system, remember that the most effective displays balance transparency with privacy, celebration with sensitivity, and individual growth with collective achievement. With the right tools and approach, every classroom can transform raw data into inspiring visual stories that motivate students to reach their full potential.