How a Poster Making Machine Saves Teachers 20+ Hours Every Month

The Hidden Cost of Handwritten Anchor Charts
Why Modern Teachers Are Switching to Digital-First Visual Learning
Let me paint a familiar picture: It’s Sunday evening, and while your family watches a movie, you’re hunched over poster board with markers scattered everywhere, carefully lettering tomorrow’s math anchor chart. Sound familiar? The truth about poster making machine time savings might just change your entire approach to classroom visuals—and give you back those precious weekend hours.
Poster Making Machine Time Savings: The Numbers That Shocked Me
During my student teaching, I tracked every minute spent creating classroom materials. The results? I was dedicating over 25 hours each month to hand-drawing anchor charts, word walls, and instructional posters. That’s basically a part-time job on top of my full-time teaching responsibilities!
According to a 2021 RAND Corporation study, teachers work an average of 53 hours per week, with much of that overtime spent on classroom prep. When I discovered how a printer for posters could slash my prep time, everything changed.
Here’s the breakdown of my typical month before making the switch:
– Anchor charts: 8-10 hours
– Word walls: 4-5 hours
– Student celebration posters: 3-4 hours
– Instructional guides: 6-8 hours
– Seasonal displays: 3-4 hours
That’s an entire day of teaching lost to marker fumes and hand cramps every single month!
The Real Cost Beyond Time
But time isn’t the only factor. Honestly, let’s talk dollars and cents. My monthly supply runs for chart paper, quality markers, and correction tape averaged $45–60. Over a school year, that’s nearly $500 from my own pocket—and that’s before counting the emotional cost of Sunday night stress.
Research from the Learning Forward 2022 Teacher Survey shows that 94% of teachers spend their own money on classroom supplies, averaging $820 per year. Handwritten charts eat up a significant chunk of that budget.
Why Handwritten Charts Drain More Than Your Wallet
During parent-teacher conferences last fall, one mother asked why our word wall looked “tired.” I glanced at the fading markers and smudged letters—charts I’d lovingly created just two months earlier. That’s when the hidden costs really hit me:
Physical Toll: After a full day of teaching, spending another hour bent over poster board led to persistent neck and back pain. My doctor actually prescribed physical therapy, linking my posture issues directly to “repetitive craft activities.”
Mental Exhaustion: Decision fatigue is real. Choosing colors, layouts, and fonts for every single chart depleted the creative energy I needed for actual lesson planning. The cost per print analysis showed me how much mental bandwidth I was wasting.
Storage Nightmares: Where do you keep 30+ anchor charts? My tiny classroom closet overflowed, and charts constantly got crumpled or torn. I spent countless minutes hunting for specific charts buried in the pile.
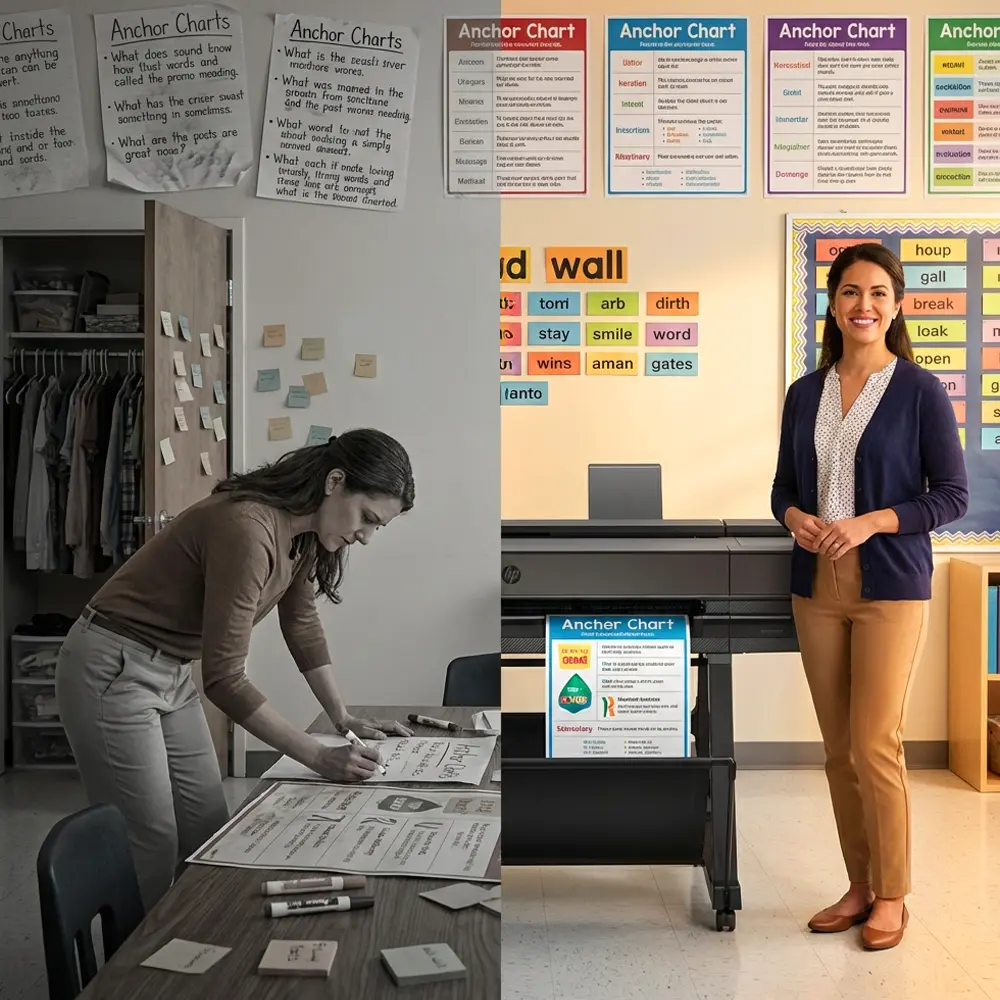
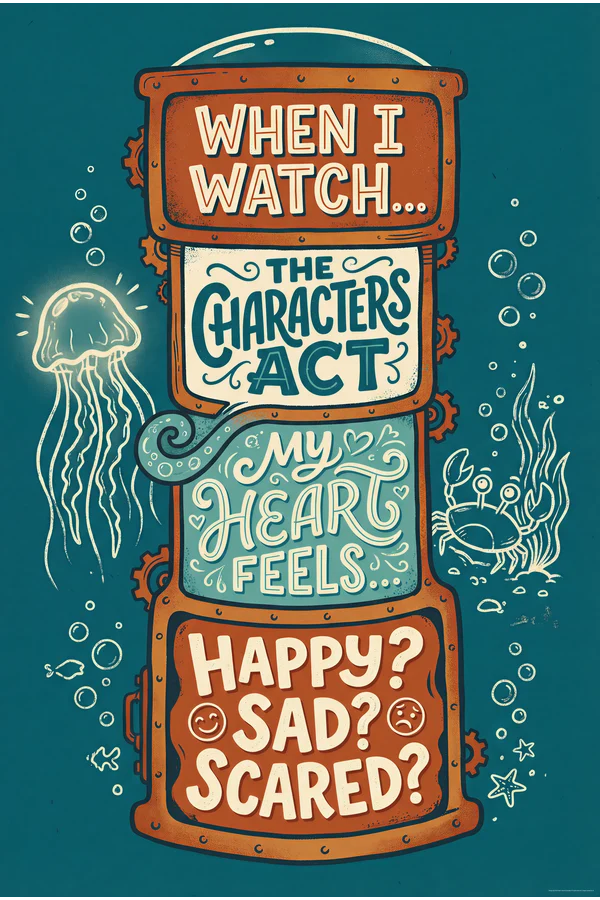
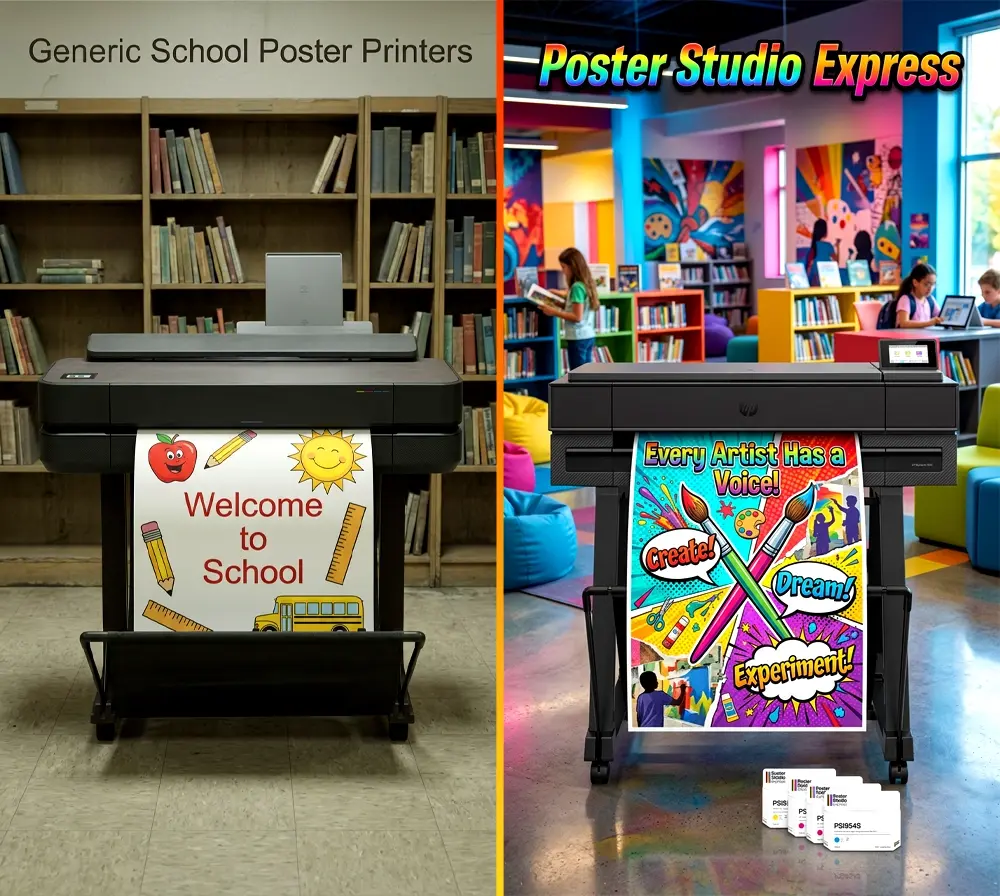
A before-and-after view of how poster making machines reduce workload and classroom clutter.
The Perfectionism Trap
Here’s something we don’t talk about enough: the pressure to create Pinterest-perfect charts. Truthfully, I’d spend an extra hour redoing letters that weren’t quite right, comparing my work to those pristine classroom photos online. That perfectionism spiral stole time from actually connecting with students.
One colleague admitted she’d stayed until 8 PM redoing a chart because a parent volunteer commented that her handwriting “could be neater.” That’s when I realized we needed a better solution.
Digital Tools Transform Teaching Reality
When our principal introduced the Education Express Package A, I was skeptical. Could a poster making machine really replicate the personal touch of handwritten charts?
The answer surprised me. Not only could it match the quality—it exceeded it in ways I hadn’t imagined:
Consistency Across Classrooms: Our grade-level team could now share digital files, ensuring all first-grade rooms had matching phonics charts. This visual consistency helped students transitioning between classrooms for interventions.
Instant Updates: When our district adopted new sight words mid-year, I updated and reprinted our word wall in 15 minutes. Previously, that would’ve meant an entire evening of rewriting.
Accessibility Features: Digital design meant I could easily adjust fonts for dyslexic learners, add visual symbols for ELL students, and create high-contrast versions for visually impaired students. Hand-drawing these variations would’ve been impossible.
Real Teachers Share Their Transformation Stories
Sarah, a third-grade teacher from rural Tennessee, shared her experience: “I was spending every Sunday afternoon making charts. Now I design them during my planning period and print while teaching. My husband jokes that he finally got his wife back on weekends!”
Marcus, teaching fifth grade in urban Chicago, calculated his time savings: “Twenty hours monthly back in my pocket. I use that time for family, exercise, and actually planning engaging lessons instead of just making materials. My teaching improved because I’m not exhausted anymore.”
These aren’t isolated stories. A 2021 Wallace Foundation report found that reducing administrative tasks directly correlates with improved teacher satisfaction and student outcomes.
Making the Switch: My Journey to Digital-First
The transition wasn’t instant. I worried about losing the “personal touch” of handwritten materials. But here’s what actually happened:
Week 1: I spent my usual Sunday creating digital templates instead of hand-lettering. The lifetime design service helped me convert my favorite anchor chart styles to digital formats.
Week 2: Printed my first batch using the printer for posters. Students didn’t even notice the change—except one who said the letters were “easier to read now!”
Week 3: Collaborated with my grade-level team to build a shared library of charts. We each contributed designs, multiplying our resources without multiplying our work.
Month 2: Realized I hadn’t brought work home in three weeks. My Sunday evenings were mine again.
The Unexpected Benefits
Beyond time savings, digital poster creation unlocked possibilities I hadn’t considered:
Student Involvement: Kids could now help design charts using kid-friendly software. This ownership increased their engagement with the material exponentially.
Parent Communication: I started sending digital versions of our charts home, helping parents support learning. One mom printed our math strategies chart for homework help.
Professional Development: Sharing polished materials at district meetings elevated my professional reputation. Other teachers started asking for my templates.
Calculating Your Personal ROI
Let’s get practical about poster making machine time savings. Here’s how to calculate your own return on investment:
Time Calculation:
– Track your current monthly hours creating charts
– Multiply by your hourly wage (or what you’d pay a babysitter)
– Compare to the 2-3 hours monthly with digital tools
Money Calculation:
– Add up monthly supply costs (markers, paper, laminating)
– Factor in storage solutions and replacement materials
– Compare to the cost per print of digital posters (typically $1.30-$1.50)
Wellness Calculation:
– Consider physical therapy costs or pain medication
– Value your mental health and family time
– Factor in the career longevity that comes with sustainable practices
Most teachers find they recoup their investment within 3-4 months, not counting the invaluable personal benefits.
Addressing Common Concerns
“But I’m not tech-savvy!” I get it. I accidentally deleted my first digital chart three times. However, modern poster making machines are designed for educators, not engineers. The learning curve is gentle, and support is always available.
“Will it feel less personal?” Initially, I worried about this too. But I discovered that having more time to plan meant my lessons became more personal and responsive to student needs. The charts were just tools—the teaching remained deeply human.
“What about the investment?” Yes, there’s an upfront cost. But when I calculated my yearly spending on supplies plus the value of my time, the Teacher Pro Solo Package paid for itself within one semester.
Creating Sustainable Teaching Practices
More importantly, the switch to digital poster creation isn’t just about efficiency—it’s about sustainability in our profession. Teacher burnout rates have reached crisis levels, with RAND reporting that stress is the primary factor driving educators from the classroom.
By reclaiming those 20+ hours monthly, we’re not just saving time—we’re preserving our passion for teaching. I now have energy for what matters most: connecting with students, differentiating instruction, and continuing my own professional growth.
Building a Supportive Community
One unexpected benefit? The community that formed around our school’s poster making machine. Teachers started sharing design tips during lunch, collaborating on themed displays, and celebrating each other’s creativity. The machine became a hub for professional collaboration rather than another isolated task.
We even started “Poster Parties” where grade-level teams would design together, turning what was once solitary weekend work into joyful professional development. The 5-year warranty meant we invested in long-term community building, not just equipment.
Your Next Steps Toward Freedom
Ready to reclaim your evenings and weekends? Here’s your action plan:
1. Track Your Time: For one week, log every minute spent on classroom visuals. Include shopping, creating, and organizing time.
2. Calculate Your Costs: Keep receipts for all chart-making supplies. Don’t forget gas money for supply runs!
3. Envision Your Ideal: What would you do with an extra 20 hours monthly? Be specific—this vision will motivate your transition.
4. Explore Options: Schedule a demo to see how a printer for posters actually works. Ask about trial periods or payment plans.
5. Start Small: You don’t need to digitize everything immediately. Begin with one high-use chart type and expand from there.
The Ripple Effect
When teachers have time for self-care, students benefit. When we’re not exhausted from weekend prep work, we bring more creativity and patience to Monday morning. When our materials are professional and accessible, all learners can succeed.
The poster making machine time savings creates ripples throughout your entire teaching practice. It’s not just about pretty posters—it’s about sustainable, joyful teaching that keeps passionate educators in classrooms where they belong.
As I write this, it’s Sunday evening. But instead of hunched over poster board, I’m sharing my story with you, hoping to spare another teacher those marker-stained Sunday nights. My charts for next week? Already printed and ready. My evening? Blissfully my own.
The hidden cost of handwritten anchor charts isn’t just time or money—it’s the pieces of ourselves we sacrifice for perfection. Digital tools don’t replace the heart we put into teaching; they simply free us to share more of it with the students who need us most.
Ready to make the switch? Your future self—and your family—will thank you. Call 866-788-7900 to learn how a poster making machine can transform your teaching life, or explore the options that have already changed thousands of classrooms across America.
Because great teaching shouldn’t require sacrificing your personal life. It’s time we embraced tools that honor both our profession and our humanity.