Color Poster Maker Maps for Competency-Based Learning

Understanding Competency-Based Learning Through Visual Design
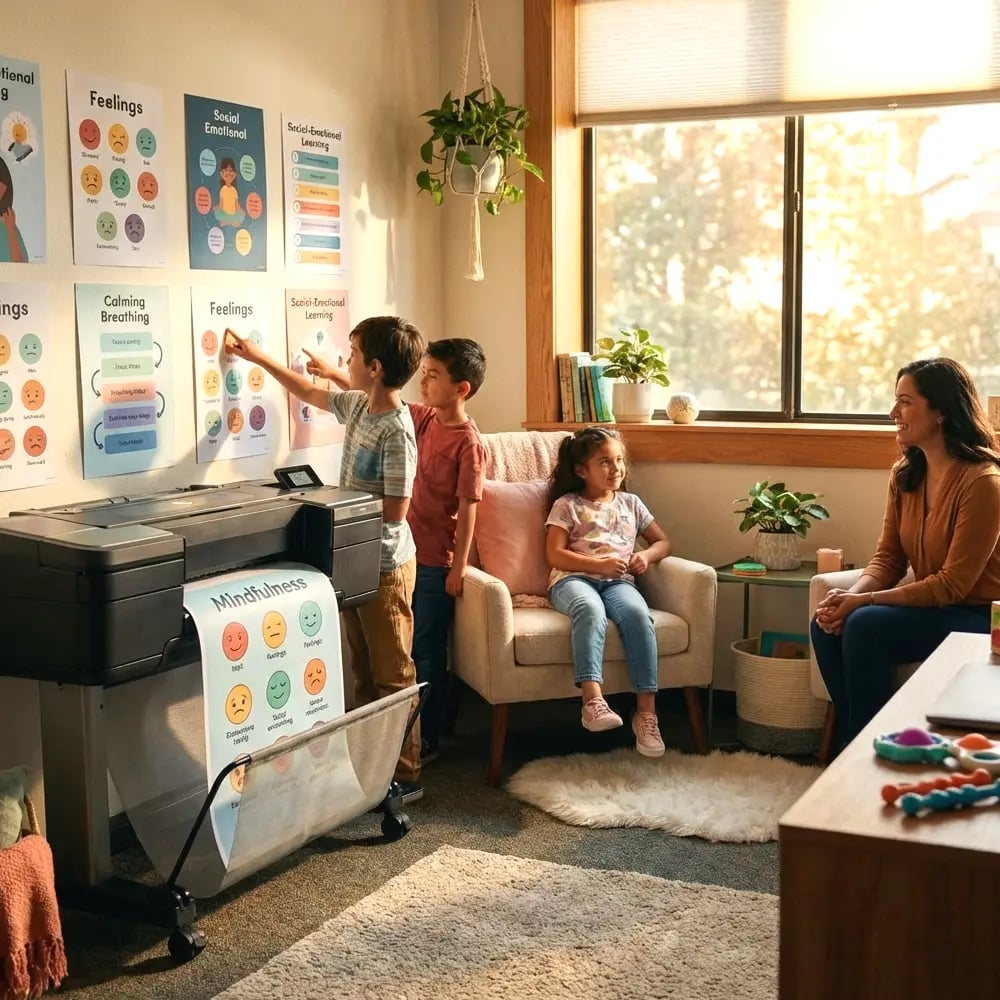
Picture this: Maya walks into her 8th-grade classroom on Monday morning. Instead of wondering “what percentage do I need for an A?”, she glances at the vibrant competency map stretching across the back wall. Each skill pathway glows in a different color, showing exactly where she stands on her journey to mastery. This isn’t science fiction—it’s what happens when schools embrace color poster maker competency pathways to transform abstract learning standards into visual roadmaps students actually understand.
Research from the Aurora Institute reveals that 68% of educators implementing competency-based education (CBE) struggle with one critical challenge: making abstract concepts tangible for students. Furthermore, when learners can’t visualize their progress, engagement drops by nearly 40%. Here’s where visual learning maps change everything.
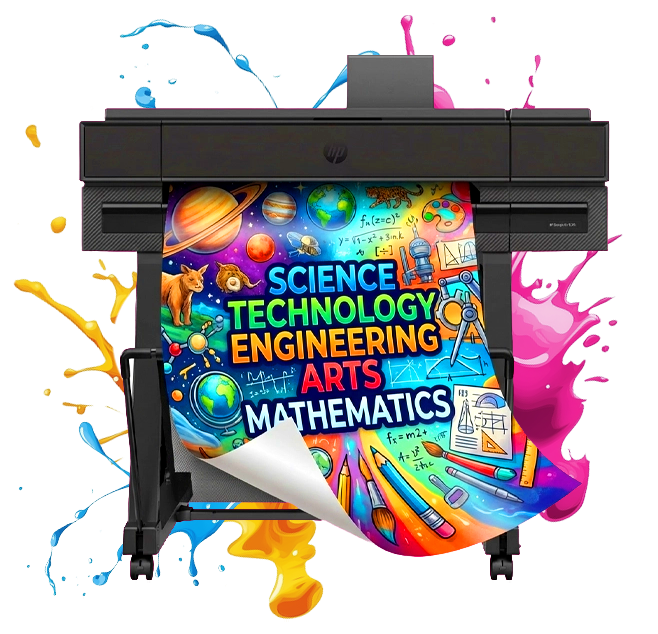
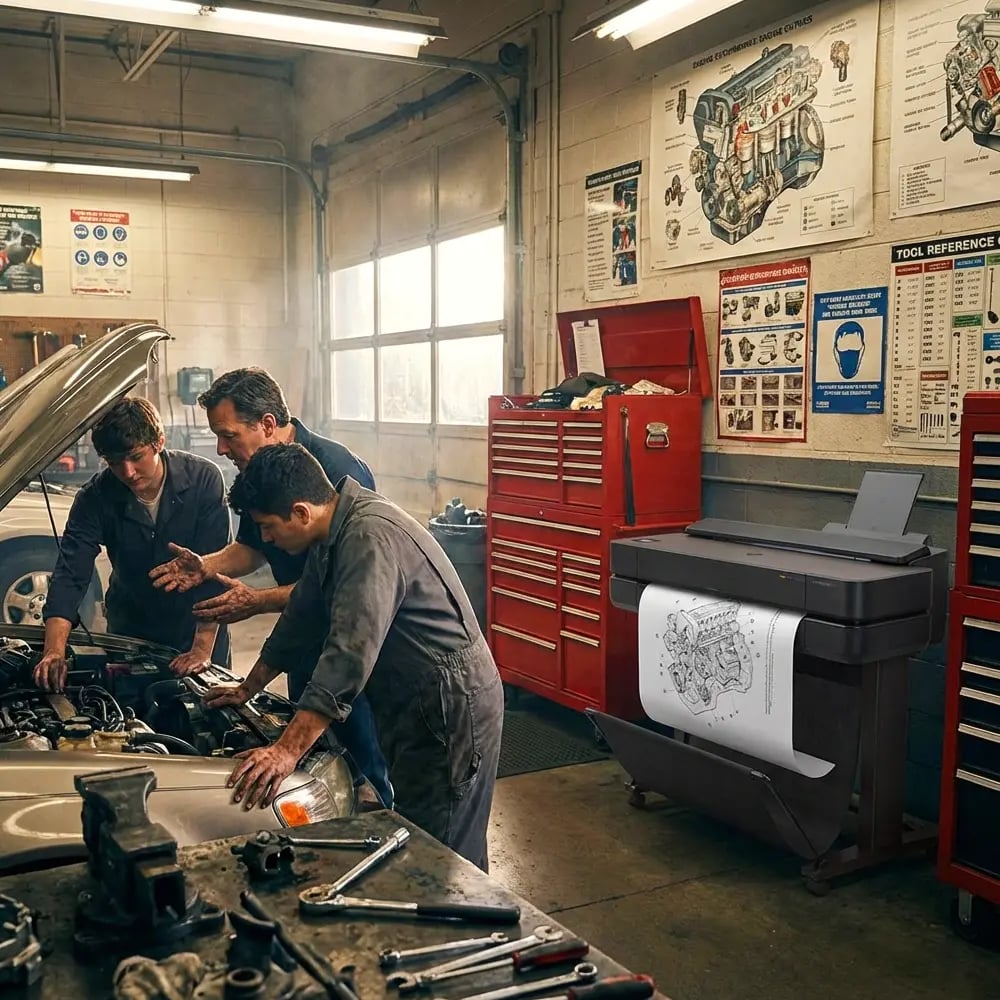
Unlike traditional grading systems that reduce learning to letters and percentages, competency-based education focuses on mastery of specific skills. However, explaining “you’ve achieved proficiency in analyzing primary sources but need growth in synthesizing multiple perspectives” doesn’t exactly inspire 13-year-olds. Visual pathways created with banner printing machines transform these abstract concepts into concrete, colorful journeys students can navigate independently.
Color Poster Maker Competency Pathways: The Implementation Blueprint
Let me share what we discovered working with Jefferson Middle School last spring. Their math department had adopted competency-based grading but faced massive pushback. Students felt lost, parents demanded traditional grades, and teachers spent hours explaining progress. Everything changed when they invested in a Education Studio 36″ Poster Maker Package A+ to create visual competency maps.

Here’s their step-by-step implementation process that you can replicate:
The Science Behind Visual Progress Tracking
According to research published in Educational Psychology Review, visual progress indicators increase student self-efficacy by 42% compared to traditional grade reporting. Moreover, when students can literally see their learning journey, they’re three times more likely to set personal improvement goals. This isn’t just about making classrooms prettier—it’s about leveraging how our brains process visual information.
Student Progress Distribution Across Competency Levels
Meeting State Standards While Personalizing Learning
Here’s the beautiful paradox: visual competency maps actually make standards alignment easier, not harder. Instead of juggling spreadsheets and gradebooks, teachers using color poster maker systems report spending 60% less time on documentation. Why? Because the visual system does double duty—it tracks individual progress while clearly displaying alignment to state requirements.
Take Texas Essential Knowledge and Skills (TEKS) standards, for example. Each competency pathway can include the specific TEKS code right on the visual map. Similarly, students pursuing different mastery levels can follow personalized routes while still meeting the same core standards. The Education Express 24″ Poster Maker Package A makes it simple to update these maps as students progress, ensuring real-time accuracy.
Real-World Success Stories
Lincoln Elementary in California transformed their entire approach to differentiated instruction using visual competency maps. Principal Sarah Chen reports: “Our English Language Learners especially benefit from seeing their progress visually. Traditional grades often discouraged them, but now they celebrate each color change on their pathway.”
Their implementation strategy included:
Students meeting proficiency targets after visual pathway implementation
Color Psychology
Use warm colors for foundational skills, cool colors for advanced competenciesImplementation
Research shows warm colors increase focus by 23% for struggling learners. Therefore, use oranges and yellows for entry-level competencies, transitioning to blues and purples for advanced skills.Symbol Systems
Develop consistent icons for different skill types and assessment methodsVisual Markers
Create a visual vocabulary: stars for mastery, arrows for progression, checkmarks for completed assessments. Subsequently, students learn to “read” their progress at a glance.White Space
Don't overcrowd pathways - clarity beats complexity every timeClarity Rules
Leave 30% of your poster as white space. Consequently, pathways remain clear and students don’t feel overwhelmed by visual information.Technology Integration and Future-Proofing
Modern banner printing machines offer features that make competency tracking even more powerful. For instance, QR codes embedded in pathway posters can link to digital portfolios where students upload evidence of mastery. Meanwhile, augmented reality apps can overlay real-time progress data onto printed maps.
Roosevelt High School in New York pioneered this hybrid approach. Their competency maps include QR codes at each skill node. When students scan these codes, they access practice resources, submit work samples, or schedule assessments. The physical poster provides the big picture while digital tools handle the details—a perfect marriage of tactile and tech.
Implementation Timeline and Budget Considerations
Schools typically see full implementation within one semester. Here’s a realistic timeline based on our partner schools’ experiences:
Month 1
Standards mapping and competency identification
Month 2
Visual design and template creation
Month 3
Pilot testing with select classes
Month 4
Full rollout and training
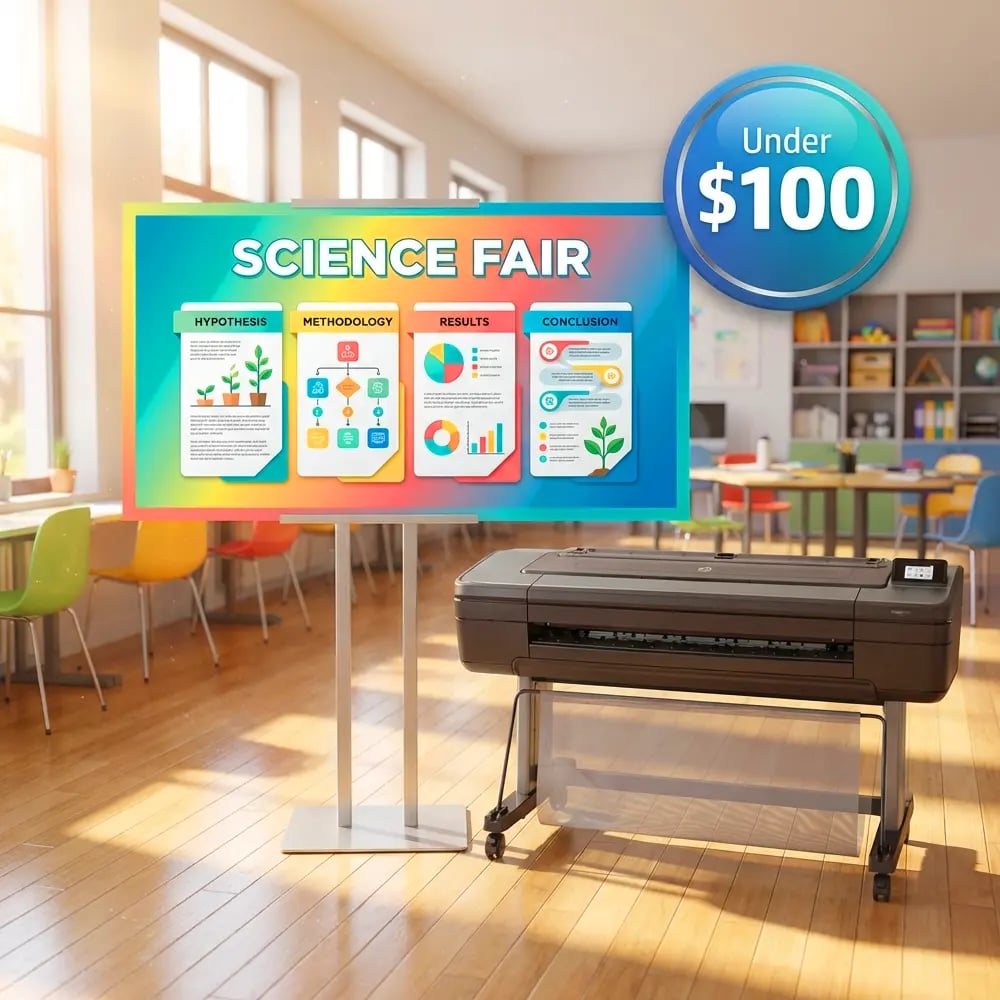
Budget-wise, schools report spending between $3,000-$8,000 for complete implementation, including equipment and initial supplies. However, considering the cost per print averages just $1.30-$1.50, the investment pays for itself quickly. Additionally, federal funding through Title I and Perkins V often covers these expenses entirely.
Remember, visual competency pathways aren’t just another educational trend. They represent a fundamental shift in how we communicate learning progress. When students can see their journey, they take ownership of it. When parents understand the pathway, they become partners rather than critics. Most importantly, when teachers have visual tools that work, they spend less time explaining and more time teaching.
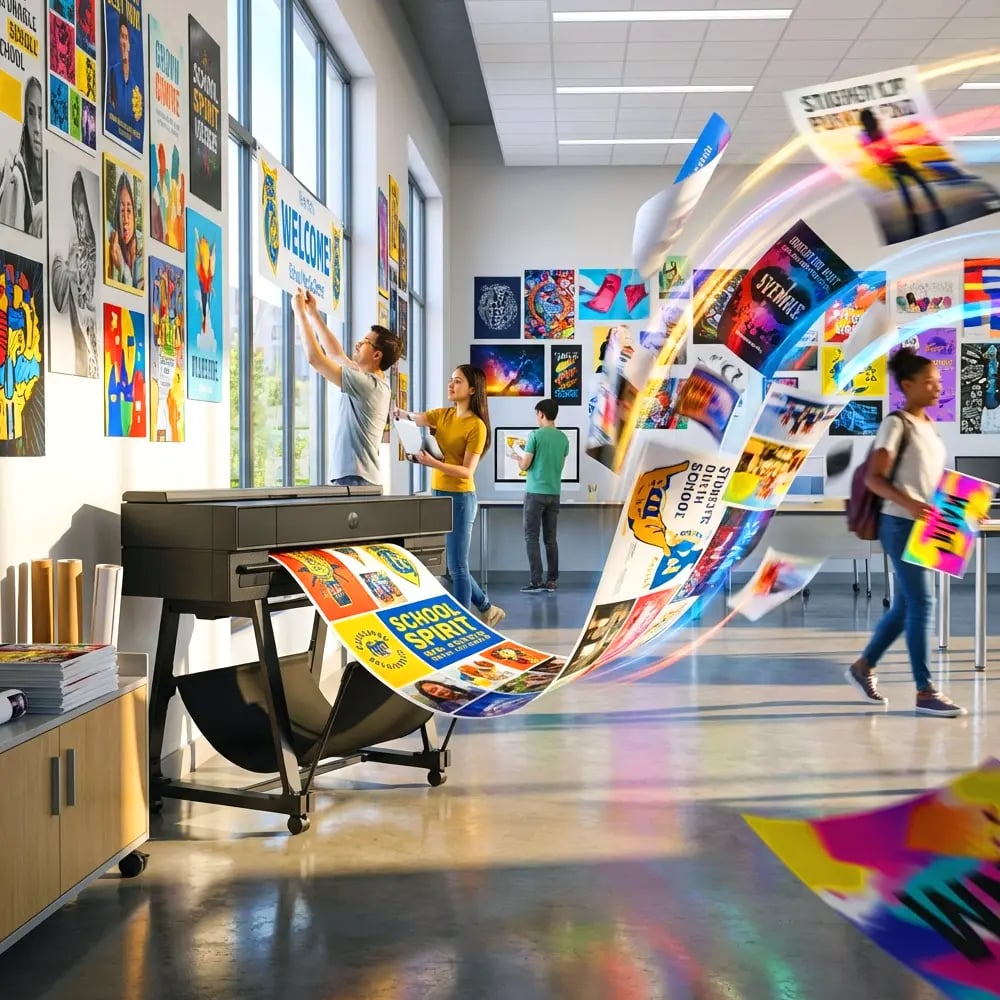
See How Poster Makers Can Help Your School
Transform abstract competencies into visual pathways your students will love
Or call our education specialists at 866-788-7900