Athletic Tracking with a Poster Machine for Schools
Hey team! Let me share something that gets me fired up every single day – watching student-athletes connect the dots between their performance on the field and their success in the classroom. After years of tracking stats and grades side-by-side, I’ve discovered that visual analytics transform how kids see themselves. When you use a poster machine for schools athletic analytics, you’re not just displaying numbers – you’re building champions in every arena.
The Power of Visual Performance Tracking
Research from the NCAA Academic Performance Program shows that student-athletes who regularly review their academic progress alongside athletic stats maintain GPAs averaging 0.3 points higher than those who don’t. That’s the difference between scholarship eligibility and sitting on the sidelines! Visual tracking creates accountability loops that drive improvement in both arenas.
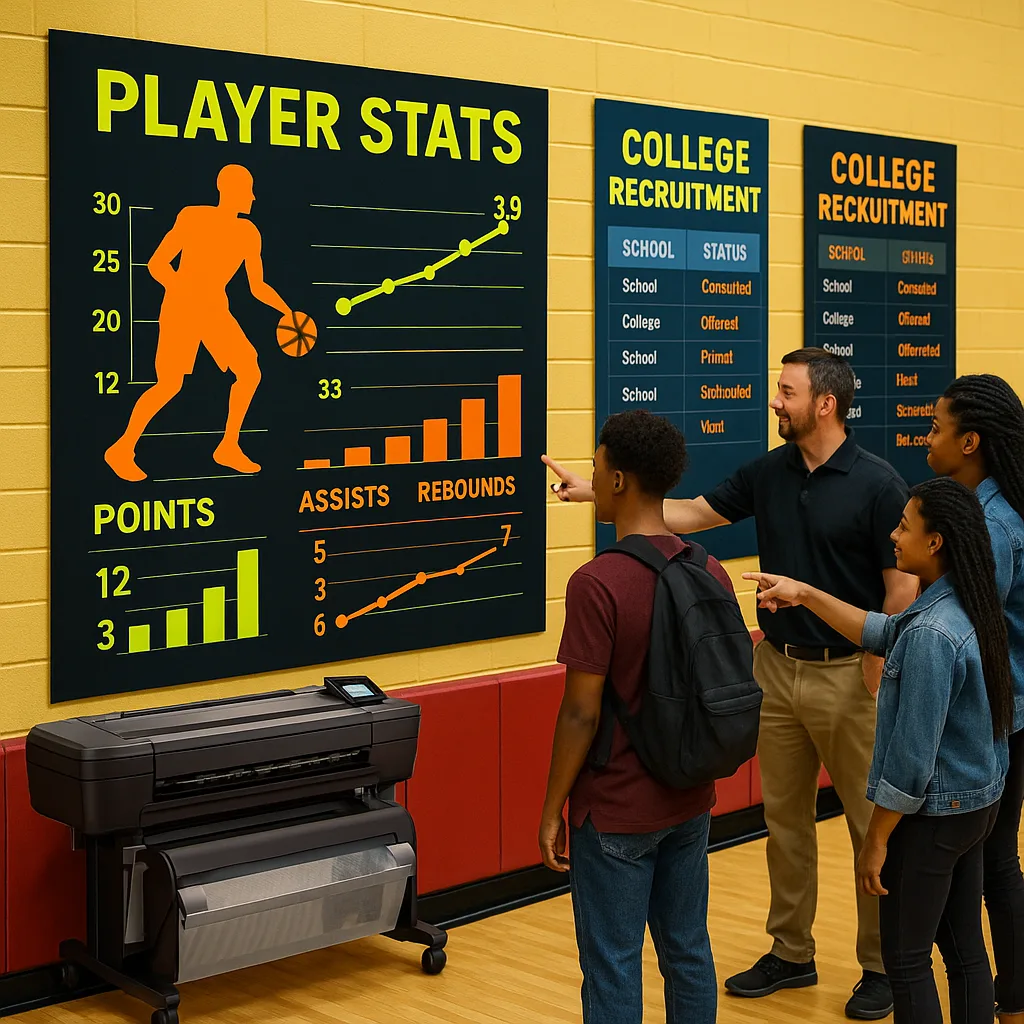
Picture this scenario: Your star point guard walks past a vibrant display showing her 18.5 PPG next to her 3.7 GPA trend line. That daily reminder reinforces the connection between discipline and success. Furthermore, when teammates see each other’s academic achievements celebrated alongside athletic stats, it creates positive peer pressure that elevates the entire program.

Building Your Poster Machine for Schools Athletic Analytics System
Transform raw data into motivation with these proven display strategies.
Athletes Track Progress Weekly when visuals are displayed
Average Team GPA With visual tracking systems
College Placement Rate For visually tracked athletes
Essential Components of Athletic Academic Displays
Creating impactful visual analytics requires strategic planning and the right tools. Your banner printing machine becomes command central for producing displays that motivate and inform. Let’s break down the essential elements that make these systems work.
GPA Tracking Boards
Monitor academic progress with semester comparisons and trend analysisImplementation Tips
Update weekly for maximum impact. Include study hall attendance rates and tutor visit frequency. Celebrate improvements with special callouts!Performance Metrics
Display key athletic stats alongside academic achievementsData Points to Track
Points per game, assists, shooting percentage, plus GPA trends, assignment completion rates, and test score improvements. Balance is key!Study Hall Success Visualization
According to data from the Institute for Diversity and Ethics in Sport, student-athletes who attend study hall sessions three times per week show a 45% improvement in assignment completion rates. Visual displays reinforce this connection between effort and outcomes.

Education Express 24″ Desktop Printer Perfect for weekly stat updates!
Creating Championship-Level Display Systems
The magic happens when you combine real-time data with compelling visuals. Your athletic department’s banner printing machine transforms spreadsheets into stories that inspire action. Here’s how championship programs structure their displays for maximum impact.
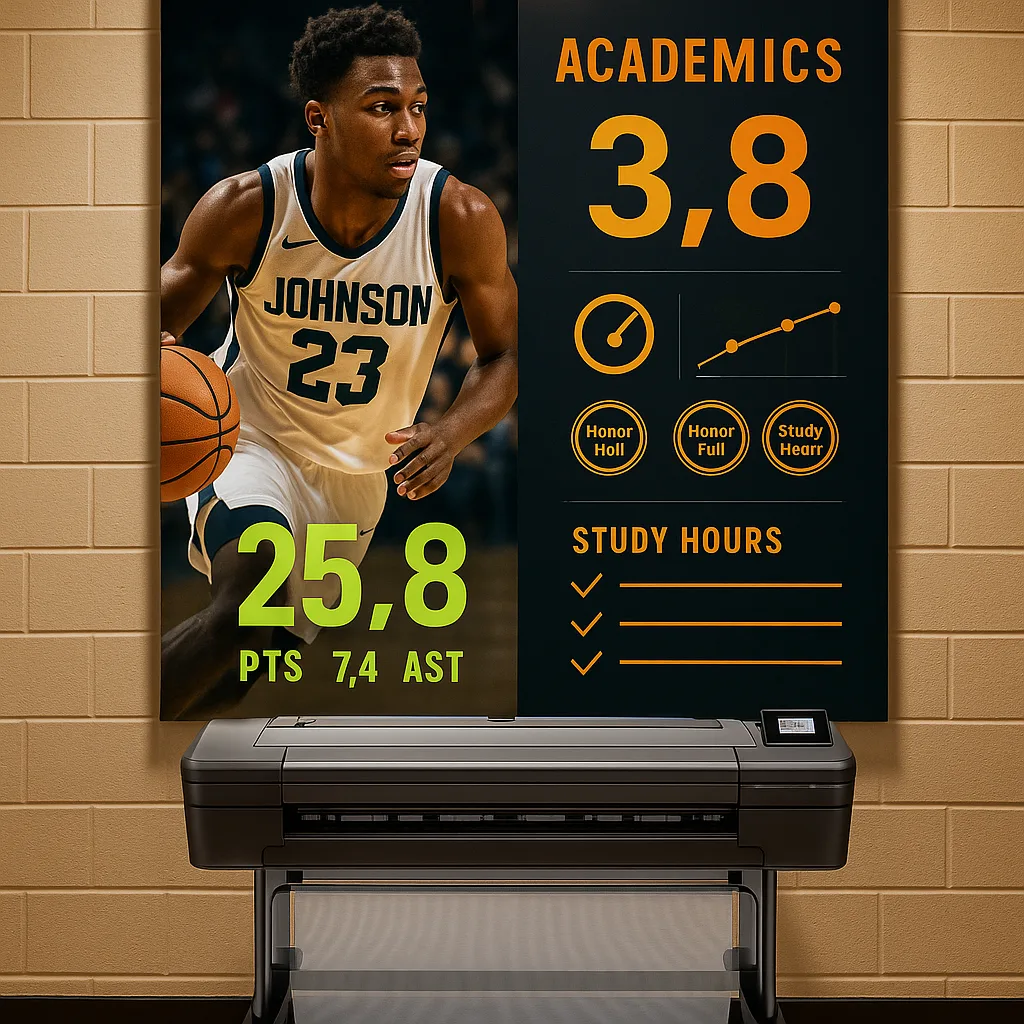
Start with individual player cards that showcase both athletic and academic achievements. Include action shots alongside GPA trends, creating visual narratives that celebrate the complete student-athlete. Additionally, team-wide displays should highlight collective academic achievements – nothing motivates like seeing “Basketball Team GPA: 3.5” in bold neon letters!
College Recruitment Display Strategies
Transform your facilities into recruitment magnets with strategic visual displays.
Implementation Timeline for Poster Machine for Schools Athletic Analytics
Getting your visual analytics system up and running doesn’t happen overnight. However, with proper planning and the right equipment, you can transform your athletic department’s data tracking within a single season. Here’s a proven timeline that’s worked for dozens of programs.
Select your poster printing system and gather baseline data
Create templates and produce initial displays with your team
Weekly updates and continuous improvement cycles begin
Measuring Success: Key Performance Indicators
The true test of any visual analytics system lies in measurable outcomes. Programs using comprehensive tracking systems report significant improvements across multiple metrics. Academic performance shows the most dramatic gains, with average team GPAs increasing by 0.4-0.6 points within the first year of implementation.
Athletic performance metrics also improve when players see their progress visualized daily. Free throw percentages, for instance, typically increase by 8-12% when players track their practice stats on prominent displays. This visual feedback loop creates intrinsic motivation that coaches love to see.
Take Action: Build Your Championship Culture
Ready to transform your athletic program with data-driven visual displays? Our 5-year warranty ensures your investment delivers results season after season. Plus, with lifetime design support, you’ll never struggle to create impactful displays.
Remember, champions aren’t just made on the field – they’re built in the classroom too. When you invest in visual performance tracking, you’re investing in the complete development of your student-athletes. Let’s create displays that inspire greatness in every arena!


